Use these steps to display an MR Touch series and to draw ROIs on the images. An alternative method is to display the MR-Touch series in READY View.
Step-by-step instructions
From the Patient List, select one of the two series you want to compare and click Viewer.
Typically select the Elastogram + Mask (Gray) series.
Follow the Compare instructions to display the second series and navigate to the desired images for both left and right viewports.
Typically select a source series.
Click the Elastogram viewport to make it active so that you are drawing the ROI on the elastogram and masked image. You can draw the ROI on either image, but you may find it easier to first draw around the masked regions and then adjust the ROI around the vessels.
From the Viewer control panel, click Measure and select the smooth curve measurement tool.
Draw a trace around the object, for example the liver. Keep the following in mind as you draw the ROI:
The masked regions are hash-marked or checkerbox areas that indicate the wave propagation was not sufficient to confidently generate stiffness contrast. Including masked (checkerbox) areas in your ROI will skew the ROI statistics.
Measurements should only be read on the Elastogram (Gray) images. Reading from the Elastogram+Mask images results in inaccurate values if any checkerbox masked region is included.
The ROI statistic AVG is the average stiffness of the tissue. It is a relative and not absolute value.
ROI should not contain any large vessels.
ROI should be drawn on regions with clear wave patterns.
It is recommended that you draw the ROI at least half a wave length from the edge of the liver, and a wave length away from the upper-dome of the liver. The waves alternate between red and blue.
Hot spots (areas of bright signal intensity) may occur adjacent to where the active driver is placed. Do not include these areas in your ROI.
With the measurement active, copy (Ctrl + C) the ROI, click the elastogram image and paste (Ctrl + V) the ROI.
Adjust the ROI to exclude anatomy in the masked area and the vessels.
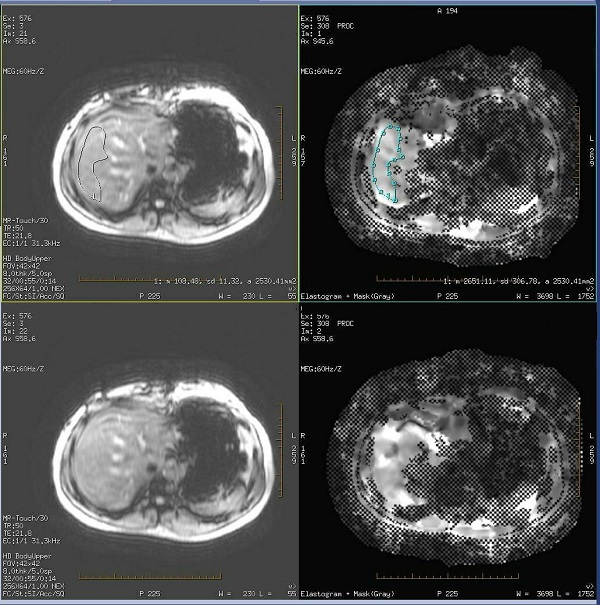
Figure 1. Measurement on source and Elastogram + Mask (Gray) series using Compare tool