

- 00000018WIA30CEE870GYZ
- id_400254961.2
- Feb 12, 2022 4:13:58 PM
T2 Map cartigram
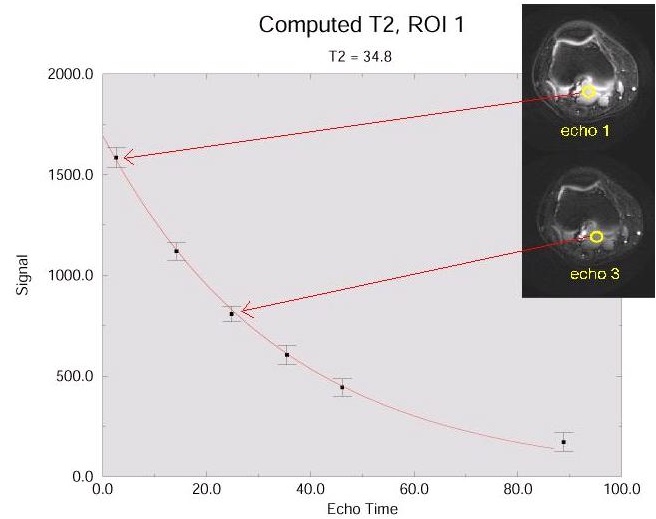
T2 MAP is used to noninvasively detect changes in the collagen component of the extracellular matrix of cartilage. T2 MAP acquires multiple scans at each location; each set of scans has a unique TE resulting in a set of gray scale images that represent different T2 weighting.
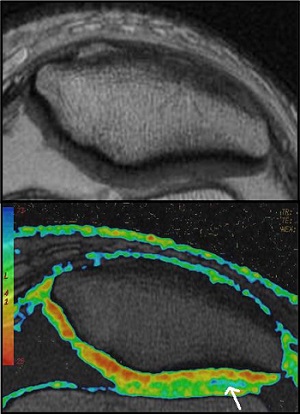
The acquired data can be processed in READY View to produce T2 color maps, which demonstrate more subtle changes in cartilage ultrastructure that are not visible on gray scale MR images. The T2 map and the parametric images produce visible image contrast changes in early stages of cartilage degeneration such as osteoarthritis.
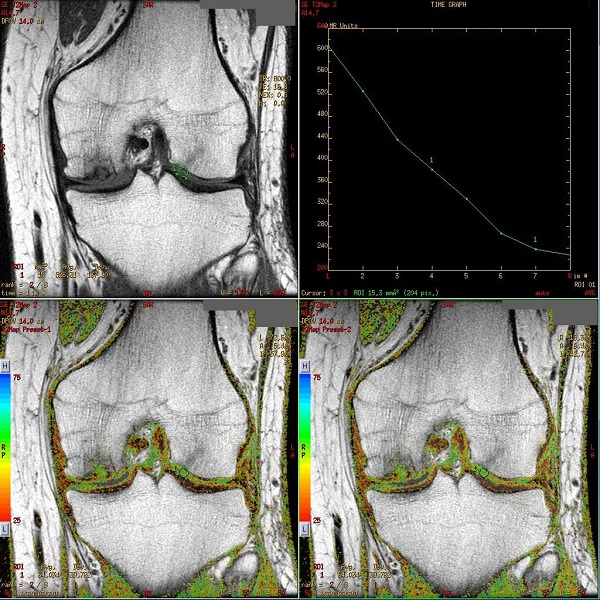
The number of TEs per scan (not selectable) determines the number of images that are acquired at each location. For example, if 10 locations are prescribed and 6 (number of TEs) per scan are prescribed, then there are 10 data sets with 6 images per location. Each image within a data set or location has six unique T2-weighted images because all lines of k-space are filled with one (each individual) TE. This differs substantially from the traditional Fast Spin Echo sequence.
sec
Collagen composition
The collagen in the radial zone of articular cartilage, close to the subchondral bone is highly ordered, with only small quantities of mobile water. By contrast, the collagen in the transitional zone is more randomly oriented, with increased mobile water and more prolonged T2 values. Increased T2 relaxation times within cartilage have been associated with matrix damage, particularly loss of the orientation of the collagen matrix.
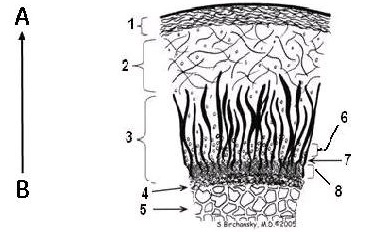
| Callouts | Description |
|---|---|
| A | Longer T2 values |
| B | Shorter T2 values |
| 1 | Superficial Zone |
| 2 | Transitional Zone |
| 3 | Radial Zone |
| 4 | Subchondral bone |
| 5 | Cancellous bone |
| 6 | Non-calcified cartilage |
| 7 | Tidemark |
| 8 | Calcified cartilage |
When the cartilage matrix breaks down due to osteoarthritis, the following occurs:
Disruption of collagen --> increased mobility of water -->prolongation of T2 relaxation times.