

- 00000018WIA3070C770GYZ
- id_400220861.6
- Apr 14, 2022 9:30:01 AM
MAGiC: post-process images
About this task
Use these steps to post-process a single scan to create parametric maps and several contrast weighted images such as T1-weighted, T2-weighted, Proton Density-weighted, FLAIR. The image contrast is controlled by virtual scanner settings of TE, TR, TI and TI2 that can be adjusted after the scan has been completed.
Important: T1 and T2 values generated via MAGiC may not correlate directly to those numbers generated by other means. Numerical T1 and T2 values are highly dependent on imaging parameters used.
Step-by-step instructions
- From the Patient List, select a prospective MAGiC series or QMaps (parametric maps) series.
Figure 1. Prospective MAGiC series 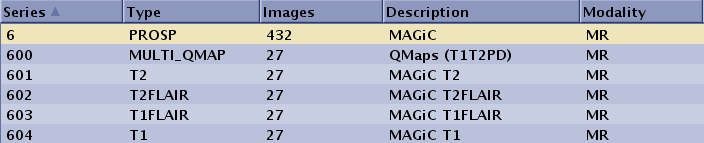
- From the Session Apps list, click MAGiC.
Figure 2. Session Apps list 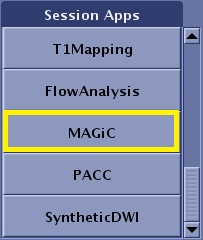
- By default, a 6-viewport display is launched with 6 unique MAGiC images.
Figure 3. 6-viewport display 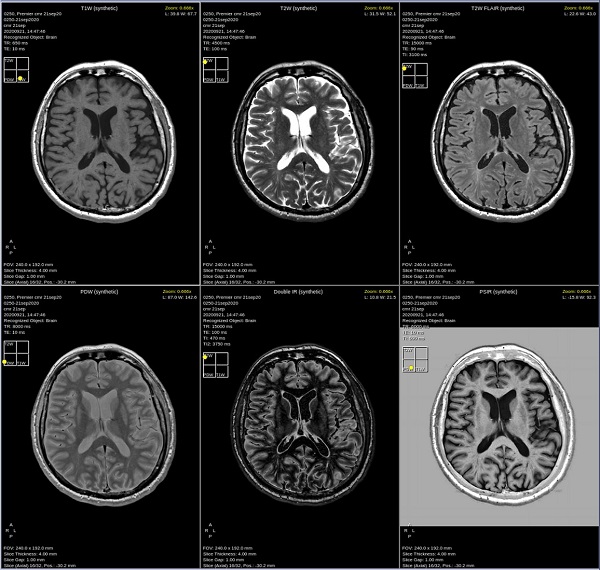
- By default, a 6-viewport display is launched with 6 unique MAGiC images.
- From the MAGiC review session, note the
 that indicates the image contrast weight: T1-weighted, T2-weighted or PD-weighted contrast. Move the yellow ball within the Contrast Navigation window to adjust and update the TR and TE values.
Figure 4. Contrast icon and TR/TE/TI parameters indicate contrast weighting 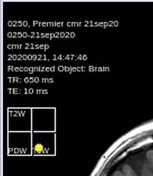
- To view a different MAGiC image in any viewport, follow these steps.
- Right-click in the viewport you want to change.
- Select a MAGiC contrast from the right-click menu.
Figure 5. Top portion of right-click menu 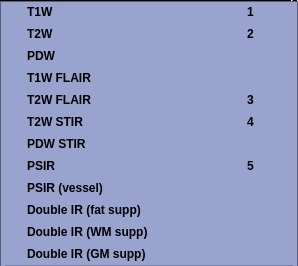
- The Viewport updates with the new MAGiC image.
Table 1. Right-click menu to change image contrast in the active viewport Right-click selection Right-click selection Click T1W to change the image contrast to synthetic T1-weighted. 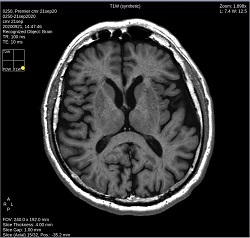
Click T2W to change the image contrast to synthetic T2-weighted. 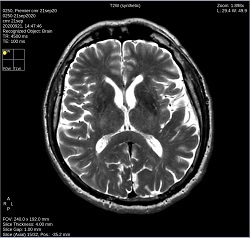
Click PDW to change the image contrast to PD-weighted synthetic. 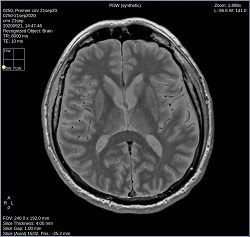
Click T1W FLAIR to change the image contrast to synthetic T1 FLAIR-weighted. 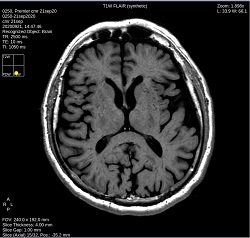
Click T2W FLAIR to change the image contrast to synthetic T2 FLAIR-weighted. 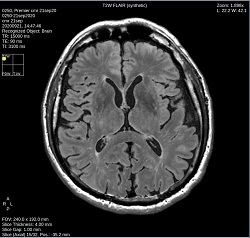
Click T2W STIR to change the image contrast to synthetic T2W STIR-weighted. 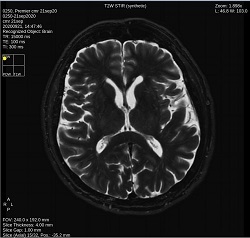
Click PDW STIR to change the image contrast to synthetic PDW STIR-weighted. 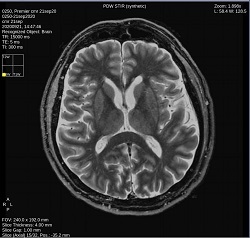
Click PSIR to change the image contrast to synthetic Phase Sensitive Inversion Recovery-weighted. 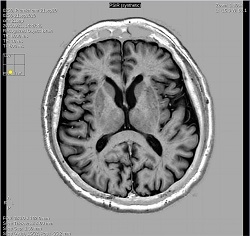
Click PSIR to change the image contrast to synthetic Phase Sensitive Inversion Recovery-weighted to better visualize vessels. 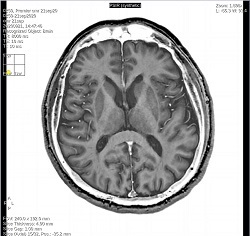
Click Double IR (fat supp) to change the image contrast to a synthetic Double IR (fat suppression) image. 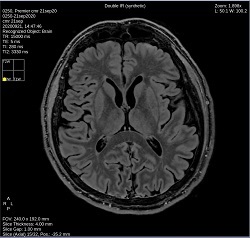
Click Double IR (WM supp) to change the image contrast to a synthetic Double IR white matter suppressed-weighted. 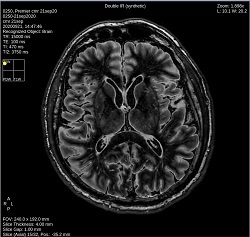
Click Double IR (GM supp) to change the image contrast to a synthetic Double IR gray matter suppressed-weighted. 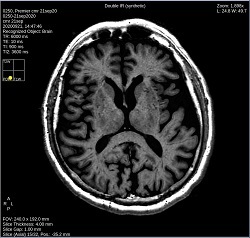
- The Viewport updates with the new MAGiC image.
- View the upper right corner of the viewport for information related to the ROI.
- The center coordinates of the ROI relative to the image are specified as ROI[#,#]. For the free-hand ROI, the center is that of its bounding rectangle.
- T1: Mean value and standard deviation of T1 within the ROI. For R1-maps, R1 is displayed.
- T2: Mean value and standard deviation of T2 within the ROI. For R2-maps, R2 is displayed.
- PD: Mean value and standard deviation of PD within the ROI.
- Value: Mean value and standard deviation of the voxel intensity. In synthetic images this will correspond to the signal strength of the simulated MRI signal.
- ROI considerations:
- Right-click inside the ROI to view the menu and select Disable ROI to remove the ROI from the viewport. Keyboard shortcut = Backspace.
- Right-click inside the ROI and select Use ROI to Null Tissue option. The contrast weight of the image can be adjusted making tissue within the ROI appear black in the image. This is done through an inversion pre-pulse with an optimized TI. To null tissue of a certain type: place and adjust the size of a ROI so that the ROI only includes tissue of the type you want to cancel out the signal from. This will adjust TI in the shown image.
- A graph displays in the lower right viewport when an ROI is placed on an image. In the graph, all voxel values in the ROI are plotted. The color indicates how many voxels have a certain combination of values. Three types of graphs are available in the right-click menu. The graph updates with each new ROI.
Figure 6. ROI graph and right-click graph menu 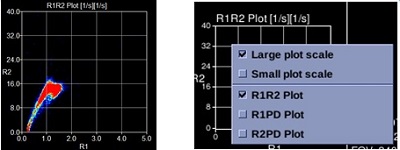
- R1R2 Plot: In the plot R1- and R2-values for all voxels within the ROI are displayed.
- R1PD Plot: In the plot R1- and PD-values for all voxels within the ROI are displayed.
- R2PD Plot: In the plot R2- and PD-values for all voxels within the ROI are displayed.