

- 00000018WIA30595970GYZ
- id_400234781.3
- May 23, 2022 3:37:01 AM
Reports
About this task
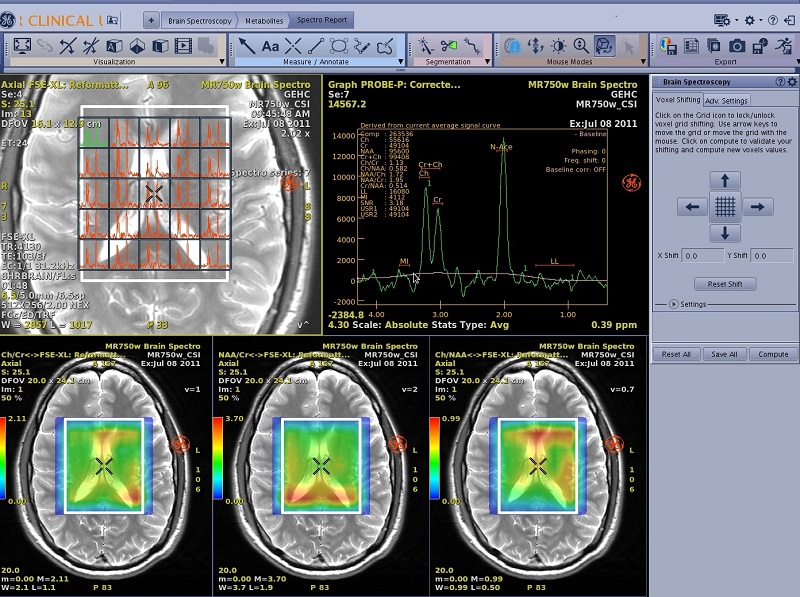
Use these steps to create a spectroscopy study report. It includes a localizer view, corrected spectrum graph view, and three metabolites maps.
Step-by-step instructions
- From the Spectroscopy Review Steps, click Spectro Report.
Figure 2. Spectro Report Review Step 