

- 00000018WIA30988970GYZ
- id_400251151.1
- Mar 16, 2022 5:11:38 PM
MR Standard
MR Standard is a time course protocol. Use MR Standard for analyzing T1-contrast or T2 contrast changes.
The READY View MR Standard protocol can be used to create the following maps:
- Enhancement integral (Negative and Positive)
- Time to peak
- Mean time to enhance
- Maximum slope of increase
- Maximum slope of decrease
Algorithms
Though the descriptions and equations below correspond to T2* contrast (negative enhancement), the principles behind the analysis remain the same for T1 contrast (positive enhancement).
| Algorithm | Description | Input parameters |
|---|---|---|
| Negative Enhancement Integral |
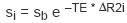
Time course data acquired during the injection of an MR contrast agent may have image intensity variations caused by changes in the magnetic resonance relaxation rate constant T2*, which result in negative enhancement. A parameter that is used to characterize these changes in T2* is the
The relationship of
Here, b denotes the background pixel intensity (base) and TE refers to the echo time of the MR acquisition (this value is a constant for a given series). The numerical integral of the
is the single valued parameter that represents the area underneath the The background intensity (baseline) is estimated by calculating an average background intensity BIA prior to the onset of the transient signal intensity change (Region A in figure below) and an average background intensity (BIB) after the completion of the transient signal intensity change (Region B). Though the descriptions and equations below correspond to T2* contrast (negative enhancement), the principles behind the analysis remain the same for T1 contrast (positive enhancement). 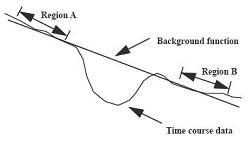 You can select whether to use a constant base for the calculation or an interpolated base to correct for the signal drift over time in the time course data. With a constant base, sb=BIA where BIAdenotes the average background intensity prior to the onset of the transient. With an interpolated base, the time course values will be corrected for the background variation by using a interpolated background intensity sb that varies linearly between the average values (BIAand BIB) of the time course intensity in regions A and B. |
The average background intensity prior to the onset of the transient (see above) is computed over the image range between the first and last pre-enhancement image. The integral is computed over the enhancement image range (between last pre-enhancement and first post-enhancement image). The sign parameter must have been set to negative. Either a constant or an interpolated base (see above) can be selected. When the negative enhancement integral functional map is displayed in the left function view, the corresponding baseline is shown on the graph view either as a blue segment for the cursor ROI curve or as a red segment for the currently selected user ROI. |
| Positive Enhancement Integral |
Time course data acquired during the injection of a contrast agent may have image intensity variations caused by changes in the magnetic resonance relaxation rate constant T1 in MR exams. This results in positive enhancement. The time course pixel intensity si is expressed as: si = s0 f(T1, t), A parameter that is used to characterize the time intensity changes is the integral of the area I under the enhancement curve.
The protocol returns the difference between the value of the integral over the image range and the pre-enhancement value. The function will be background corrected as described above for the Negative Enhancement Integral algorithm, using either a constant base or an interpolated base. |
The integral is computed over the enhancement image range (between last pre-enhancement and first post-enhancement image). The sign parameter must have been set to positive. Select a constant or an interpolated base as required. When the positive enhancement integral functional map is displayed in the left function view, the corresponding baseline is shown on the graph view either as a blue segment for the cursor ROI curve or as a red segment for the currently selected user ROI. |
| Time to Peak and Time to Minimum |
Time–to–peak (TTP) is the time between the onset of a positive enhancement transient and the peak value of the time curve (image with the maximum value before the first post-enhancement image). Time–to–peak is computed and displayed in seconds, using the raw time curve data directly. Time–to–minimum (TTM) is the equivalent time to the minimum value (negative peak) for a negative enhancement transient. |
Time–to–peak and time–to–minimum are computed from the onset of the transient (last pre-enhancement image). The images from the first post-enhancement image onwards are not taken into account. The sign parameter (positive or negative) determines whether time-to-peak or time–to–minimum is computed and displayed. Either a constant or an interpolated base can be used. |
| Mean Time to Enhance |
Related to the ΔR2 (negative enhancement) function, this algorithm returns the value of the normalized mean time to enhance of ΔR2 with respect to the time course index, i. Specifically, this value is given by:
The function will be background corrected as described above for the Negative Enhancement Integral algorithm, using either a constant base or an interpolated base. |
Mean time to enhance is computed and displayed only for the images between the last pre–enhancement and first post–enhancement image. Either a constant or an interpolated base can be selected. When the functional map computed with this algorithm is displayed in the left function view, the corresponding baseline is shown on the graph view either as a blue segment for the cursor ROI curve or as a red segment for the currently selected user ROI. |
| Maximum Slope of Increase or Decrease |
One way to characterize image intensity changes during a dynamic process is to calculate the slope of the time course values at each time course index, i, given by: slopei = si+1 – si. The single-valued parameter returned by the Maximum Slope of Increase algorithm is simply the maximum value of the slopei function: MAXi=0,N (slopei). By analogy, the Maximum Slope of Decrease algorithm returns the minimum value of the slopei function: MINi=0,N (slopei). |
Maximum slope is computed and displayed only for the images between the last pre–enhancement and first post–enhancement image. When the functional map computed with either of the maximum slope algorithms is displayed in the left function view, the location of the maximum slope of increase or decrease is shown on the graph view either as a blue segment for the cursor ROI curve or as a red segment for the currently selected user ROI. |
 function defined by:
 yielding
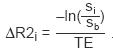
 values

MR Standard measurement units
The MR Standard functional maps have the following units of measurement.
| Maps | Units |
|---|---|
| Enhancement integral | None |
| Time to peak | seconds |
| Maximum slope of increase | None |
| Mean time to enhance | seconds |
| Maximum slope of decrease | None |
READY View protocols that use MR Standard scan data
- MR Standard
- MR Pelvis