

- 00000018WIA30C60970GYZ
- id_400251701.3
- Mar 29, 2022 11:33:55 AM
MR Standard workflow
About this task
Use these steps post process time course studies. Use MR Standard to analyze T1 or T2 contrast changes in the anatomy.
To change MR Standard settings, make a selection from the desired MR Standard screens.
Step-by-step instructions
- To view a signal intensity/time curve from an ROI, complete the following steps:
- From the Measure/Annotate toolbar, click the 3D ROI icon (
 ).
). - Place the cursor in an image viewport and left-click to deposit the ROI.
- Adjust the size and position of the ROI so that it is large enough to generalize the enhancement ranges across the volume. For more details, see Modify measurements.If needed, magnify the image by placing the cursor over the DFOV text in the upper left corner of the viewport and middle-click and drag to size the image.
Figure 1. Sample of large ROI positioned over anatomy 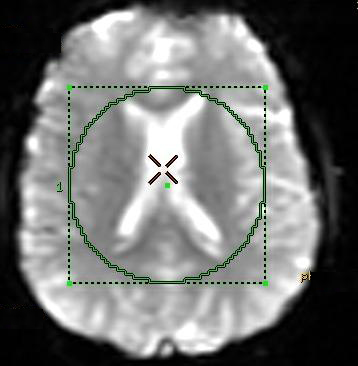
- From the Measure/Annotate toolbar, click the 3D ROI icon (
- From the MR Standard screen, click the Pre & Post Enhancement Images arrow and complete the following steps.
- The pre- and post-enhancement image numbers determine how the images will be processed. The actual image range that is used by the algorithm in the computation of the maps extends between the last pre-enhancement image and the first post-enhancement image. Use the sliders on the panel together with the curves on the graph view to set the pre- and post-enhancement image ranges.
- The pre- and post-enhancement image ranges are used by the software to define a baseline.
- The pre- and post-enhancement image ranges are defined as the ranges from first to last pre-enhancement image and first to last post-enhancement image, respectively.
- First set the post-enhancement range. Click and drag the post-enhancement slider to define the range that should start at the point where signal recovery has peaked and should end before contrast recirculation begins.
Figure 2. Range that defines post-enhancement 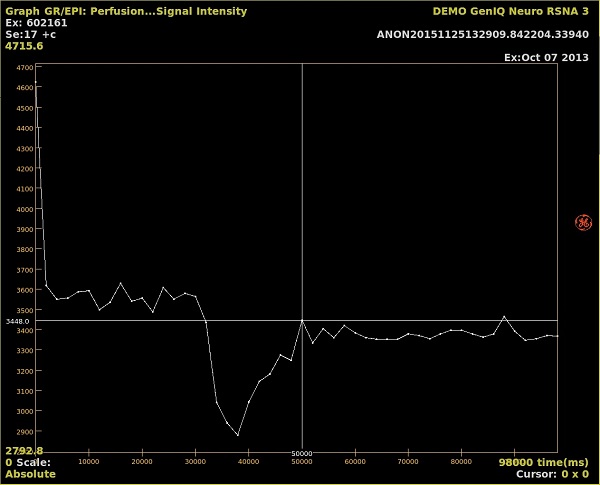
- Next, set the pre-enhancement range. Click and drag the pre-enhancement slider to define the range that should end at the point of bolus arrival and should begin at a steady-state point before bolus arrival.
Figure 3. Range that defines pre-enhancement 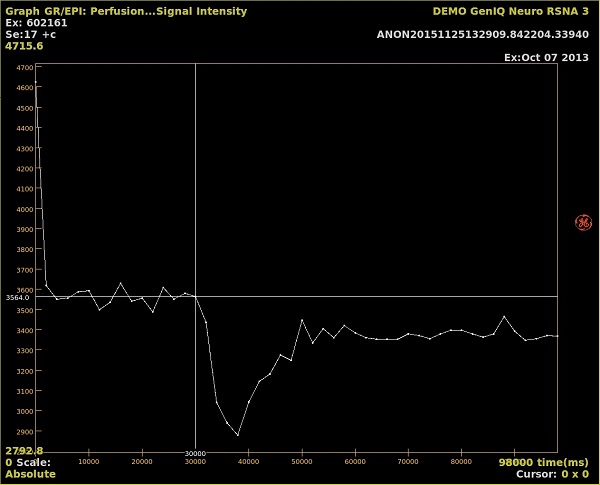
- From the MR Standard settings screen, click Compute to update the maps.
- First set the post-enhancement range. Click and drag the post-enhancement slider to define the range that should start at the point where signal recovery has peaked and should end before contrast recirculation begins.
- Ensure that the enhancement ranges are set correctly before computing functional maps in the MR standard protocol.
- Ensure that the enhancement sign is set to be consistent with the temporal characteristics of the selected images before computing functional maps.
- To view a functional curve, place the cursor in the graph view and right-click Select Displayed Curves and make a selection from the menu. A Functional curve is integrated into the curve.
Figure 4. Example of a Maximum Slope of Decrease Functional curve - note the identified section integrated into the curve 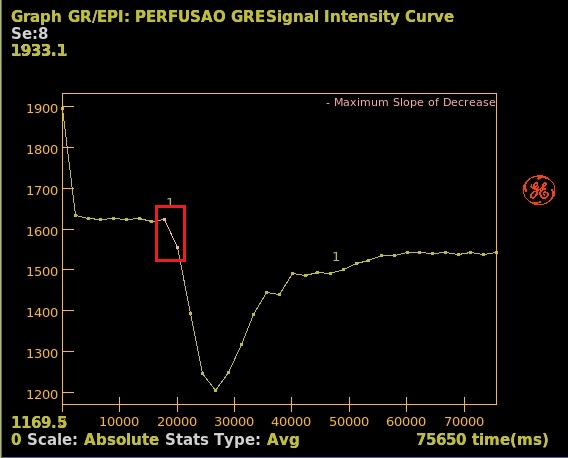
- From the MR Standard screen title bar, click the Tools icon (
 ).
). - To exit READY View, click the Exit icon (
 ).
).