Use these right-click options to modify an existing measurement such as an ROI, report cursor, straight distance, etc.
Note: The contents of the right-mouse click screen changes based on the object selected. In other words, not all options are available.
Table 1. Examples of right-click ROI screens
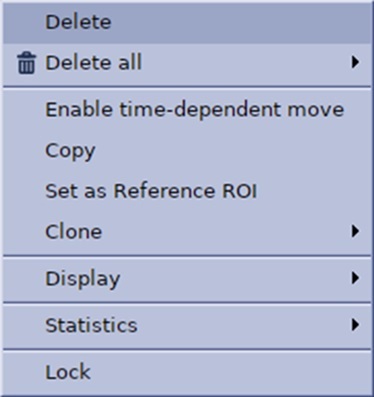
Elliptical, Rectangular, Freehand Trace ROI screen
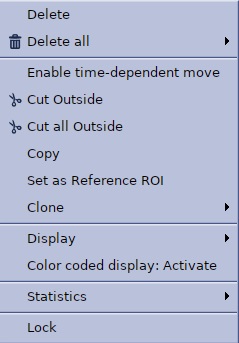
3D ROI screen
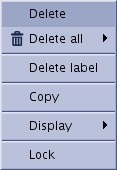
Report Cursor screen
Step-by-step instructions
Open the MR General Review.
Deposit ROIs.
Click an existing ROI in the viewport to make it active.
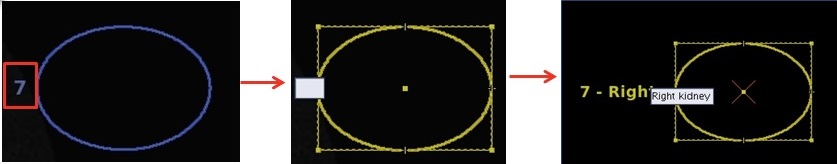
To add a label to an ROI, measurement, report cursor, complete these steps:
Click the graphic identification number.
Figure 1. Example of an ROI identification number
Type a label in the text box.
Press Enter or left-click away from the label.
Left-click the measurement (ROI, report cursor, etc.) to make it active and then right-click and make a selection from the menu.
Table 2. Right-click menu selections
Right-click option
Description/procedure
Delete
Use to delete the currently selected ROI.
Delete all
Click Delete all ROIs to delete all ROIs on all viewports.
Click Delete all Graphics to delete all graphics (user annotation and measurements) on all viewports.
An alternative method is to press the keyboard Delete.
Copy
Right-click the ROI and select Copy to copy the type, shape and size of the selected ROI.
Left-click to paste the ROI.
Clone
Right-click the ROI and select Clone to propagate to images that are the same plane in all series in the exam.
Select one of the following to have the same ROI pasted to:
All phases of the current series
All series of the current exam
All exams
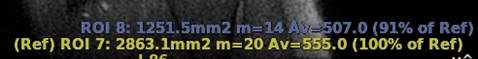
Set as Reference ROI
Use when multiple ROIs have been deposited.
Right-click Set as Reference ROI on one of the ROIs so that you can compare it with the other ROIs. Figure 2. Reference ROI is in yellow text and ROI referenced is in blue text.
Right click the reference ROI and select Reset Reference ROI to reset the Reference ROI and hide associated statistics.
The % of average of Reference ROI is not available in the Summary Table.
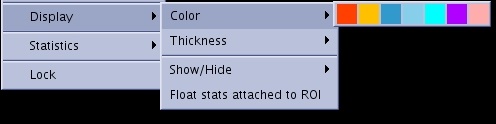
Display > Color
Click a color to change the ROI color boundaries.
Figure 3. Color selections
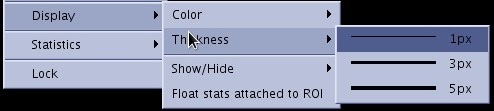
Display > Thickness
Click a thickness to change the ROI boundary thickness.
Figure 4. Thickness selections
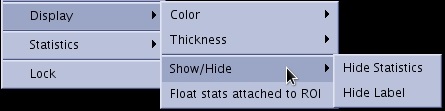
Display > Show/Hide
Use to toggle the ROI statistics on/off.
Figure 5. Show/hide selections
Display > Float stats attached to ROI
Use to click and drag the statistic associated with the active ROI to any location on the viewport.
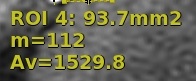
Figure 6. Floating ROI statisticsIf the statistics are not floating (locked), they appear in the viewports lower right hand corner.
Figure 7. Locked ROI statistics
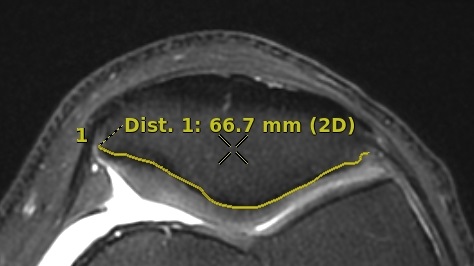
Statistics for Freehand trace
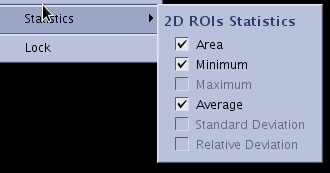
Statistics for 2D and 3D ROIs
Use to select the statistics to be displayed with the active ROI. Options include: Area, Minimum, Maximum, Average, Standard Deviation and Relative Deviation.
Figure 8. Statistics selections
Lock/Unlock
Use to toggle between the ability to lock the ROI in place or unlock it so that it can be moved.
Table 3. Options only available with 3D ROIs
Right-click option
Description/procedure
Cut Outside
Use to remove all data outside of the deposited ROI,
Click Restore Volume to restore the data cut.
Cut all Outside
Use to remove all data outside of the deposited ROI for the entire series.
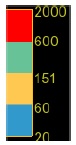
Color coded display Activate
Use to activate the color coded display. The ROI colors match the corresponding color ramp.
Table 4. Right-click color ramp options
Right-click option
Description/procedure
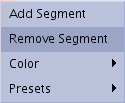
Right-click the color ramp
Right click the ROI color map on the viewport and select the desired action to perform.
Click Add Segment to add a new color above the one pointed by the cursor.
Click Remove Segment to remove the color segment pointed by the cursor.
Click Color to select the color to set for pointed color segment from the list of colors.
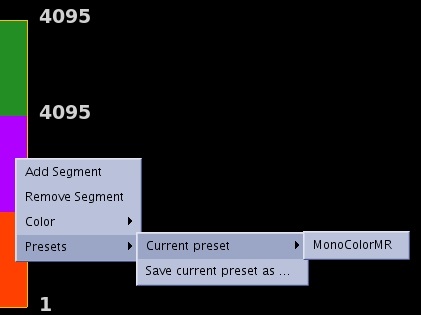
Click Presets to select a predefined color map, or save a User color map preset. Figure 9. Color ramp PresetsPlace the cursor over one of the color ramp number. Left-click (decrease) and right-click (increase) to adjust the upper and lower values from the active annotations of the color map so that only the structure of interest appears in the selected color.