

- 00000018WIA301E7970GYZ
- id_400248311.3
- Mar 29, 2022 2:45:18 PM
Active graph annotation
The graph view annotations display the image intensity curves and statistics of regions of interest in either a graph or histogram format or a spectrum or spectra.
Considerations
- The cursor ROI image intensity curve represents the change in pixel values for the pixels under the cursor of every image in the data set. This curve is automatically displayed and updated with each cursor movement.
- The ROI image intensity curves represent the same information for the pixels within the area of each ROI defined on the image views (series, function, and composite views). Each image intensity curve is annotated with the corresponding ROI number.
- An ROI number annotation is displayed whenever an ROI is selected. You can use this annotation to select an ROI. You can also select an ROI by clicking on the curve in the graph view. Note that each time, the curve is annotated with the corresponding ROI number.
- Each phase is denoted by a dot on the curve. You can place the white bar cursor over each dot and correlate it with the phase value on the horizontal scale.
- The vertical axis represents the signal point spread plotted to the graph.
- The horizontal axis (number scale) represents the image range (either image numbers or time, b–value, ppm or Hz.
- Any viewport can be changed to a graph view.
- You can change a graph view to display either a single ROI or multiple-ROIs. Right-click in a graph view and click Select displayed curves. Make a selection from the Graph Curves Selection menu.
Figure 1. Graph Curves Selection screen with single curve. The ROIs and Functional Curves area varies based on the ROIs deposited on the image and the graphs. 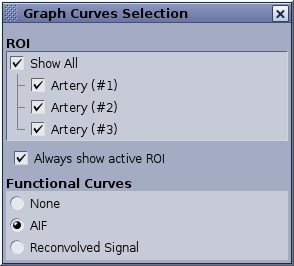
Figure 2. Example of multiple graphs displayed 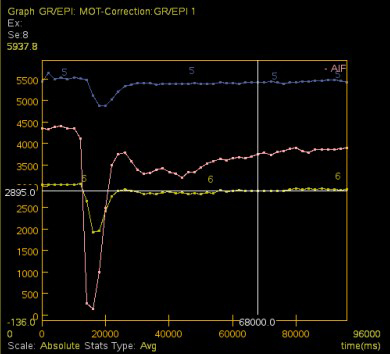
Active graph annotation procedures
| Number | Description/Procedure |
|---|---|
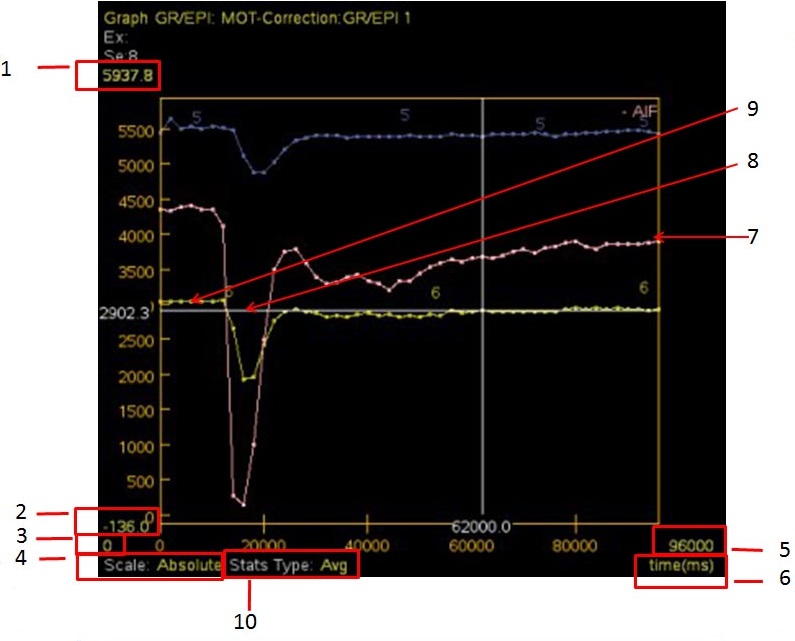
| 1 and 2 | Vertical-axis upper/lower limit annotation
Place the cursor over the yellow vertical annotation and left-click, right-click or middle-click and drag to change the scale values of the graph’s vertical axis.
|
| 3 and 5 | Horizontal-axis upper/lower limit annotation
Place the cursor over the yellow horizontal annotation and left-click, right-click, or middle-click and drag to change the scale values of the graph’s horizontal axis.
|
| 4 | Scale type
Place the cursor over the yellow scale type annotation and click and select an option: absolute, relative, percentage or shape comparison. |
| Type of statistic (not shown)
Place the cursor over the yellow ROI type, click and select the ROI pixel values as AVG (average), CURVE, MAX (maximum), CURVE, or MIN (minimum), CURVE, or DEV (deviation). | |
| 6 | Time/rank/phase
Place the cursor over the yellow rank/time annotation and left click to select either time (ms) or rank. The horizontal axis changes accordingly. |
| 7 | ROI curve, which changes based on the placement of the ROI on the image. |
| 8 | White bar
It is used to correlate a point on an image intensity curve with the reference image. If you have defined an ROI on the views and selected it (ROI and image intensity curve displayed), you can use the white moveable bars (cross hairs) on the graph view to identify the image intensity value (horizontal bar) for a given image number (vertical bar) at any point. Select the image number (or time, b–value, or ppm) by middle-clicking and dragging the cursor to the left or right on the graph view or moving the cursor to the desired location and left-click. The vertical bar follows the cursor, and the horizontal bar automatically indicates the corresponding image intensity value. The reference image corresponding to that rank point (time, b–value, or ppm) is displayed in the series view. |
| 9 | Select displayed curves type
To change this, right-click in the graph viewport and select an option from the Select displayed curves menu. |
| 10 | Stats type
Appears with a spectroscopy graph view. Place the cursor over the yellow stats type and make a selection: average curve, maximum curve or minimum curve. |