

- 00000018WIA30288970GYZ
- id_400222941.3
- Mar 17, 2022 12:26:25 PM
R2Star
The R2 Star feature uses a water proton transverse relaxation rates (R2) technique. The R2 Star values vary with tissue characteristics such as iron concentration.
Algorithms
The signal obtained from T2* decay is described by one of the following relations:
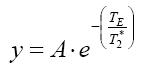
where:
S = Signal Intensity
S0 = Constant
TE = Echo Time
T2* = Transverse Relaxation Rate
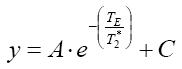
where:
C = Constant offset
Taking the logarithm of the first equation on both sides converts it into a linear equation:
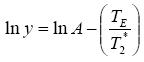
which is of the standard form:
y = mx + c
where:
m => T2*-1= R2*
c => ln(A)
The R2Star protocol provides two curve fitting options: 2-parameter and 3-parameter.
The 2-parameter algorithm is similar to T2Map in that it performs a least-squares linear fit of the log-transformed signal intensity data plotted against TE.
Success of the fitting algorithm is governed by comparison of the resultant chi-squared value with a reference threshold derived from the user-specified confidence level.
The 3-parameter algorithm is a non-linear least-squares approach that works directly on the original input signal. The fit is initialized using a trial 2-parameter run with an initial setting of C=0, after which the non-linear fit is performed.
Constraints:
The R2Star algorithm is designed to work best with 8 or more echoes. Acquisition with less than 4 echoes cannot be processed.
R2Star measurement units
The R2Star functional maps have the following units of measurement.
| Maps | Units |
|---|---|
| R2* | Hz |
| T2* | ms |
READY View protocols that use R2Star scan data
- R2*
- MR Liver