The summary table automatically captures measurements as they are made during a Volume Viewer session. Statistics can be compared over time to a reference date, which can be modified and display the percentage of change on comparison measurements.
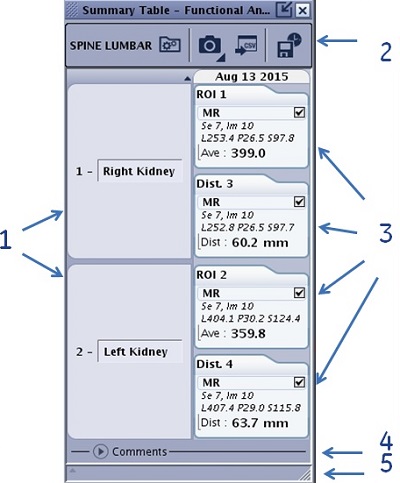
Figure 1. Summary Table screen with title bar visible
Table 1. Image legend
#
Description/procedure
1
A group of measurements. The text field is editable. Place the cursor in the text field, highlight the content and type over with new content.
2
Title bar that is only visible if the Summary Table screen is undocked.
3
Index cards that have information about the ROI or measurement.
The number of the index card correlates to the measurement annotation on the image.
The content in the measurement index card varies based on the series.
Click on MR and the cursor associated with the measurement becomes active on the image. If the volume on which the measurement was acquired, is not displayed in any viewport, an error message is displayed in the Message history area.
The check box allows you to unflag measurements for screen capture.
4
Comments area allows space for writing comments about the MR case.
5
Message history area.
Warning
While ROI statistics are calculated on displayed volumes in volume viewer (segmented or not), the summary table only displays statistics calculated from original volumes (non-segmented).