

- 00000018WIA30B55970GYZ
- id_400216551.5
- May 23, 2022 3:28:55 AM
Spectroscopy workflow
Before you begin
These buttons appear for most of the spectroscopy screen areas. When selected the spectrum viewport automatically updates.
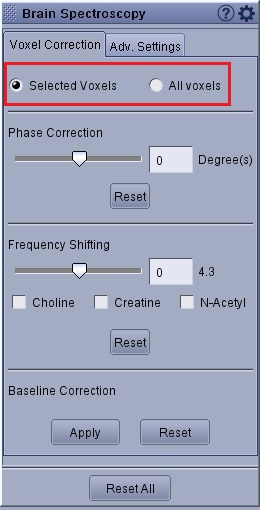
- Only Selected Voxels or All voxels can be selected.
- Selected Voxels, only corrects the active voxels, colored in green (individual voxels or ROI).
- All voxels, corrects for all voxels in the CSI VOI.
- Select Reset to reset the values of the specific function: Phase Correction, Frequency Shifting or Baseline Correction.
- Select Reset All to reset all the value(s) on the tab to the default factory values.
- Select Apply to re-calculate the metabolites based on the changes you made for the Baseline Correction.
- Select Save All to save changed selections as the new default values.
About this task
Step-by-step instructions
- Select voxel(s). By default, the graph view displays one ROI and spectrum.
Figure 2. Example of All spectra display as the default mode 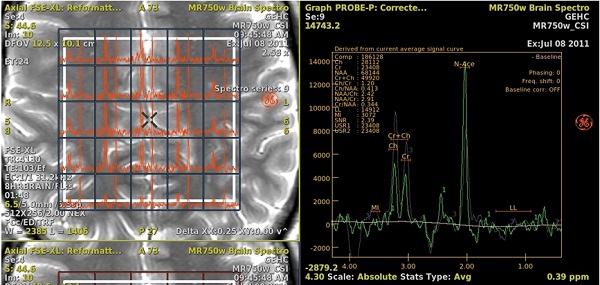
- Click a single voxel in the CSI grid and the corresponding spectrum is displayed in the graph view.
- Press the Ctrl key and simultaneously click multiple voxels and the corresponding spectra are displayed in the graph view.
- Once several voxels are highlighted in green, place the cursor on the graph and right-click the spectra viewport and click Select displayed curves.
Figure 3. Example of Right-click menu in spectra viewport 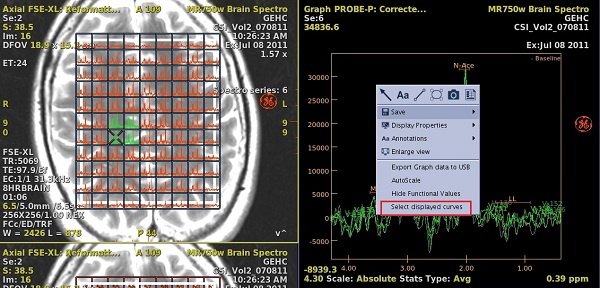
- From the Graph Curves Selection menu, click Show individual curves (default selection), which results in multiple curves displayed, one per voxel.
- De-select Show individual curves and the graph represents an average of all spectra.
Figure 4. Example of Single spectra displayed from the average of multiple selected voxels 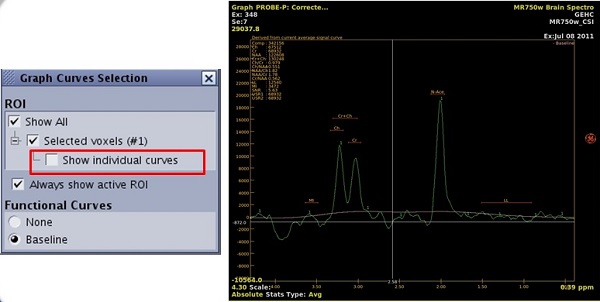
Figure 5. Example of Show All spectra displayed from multiple selected voxels 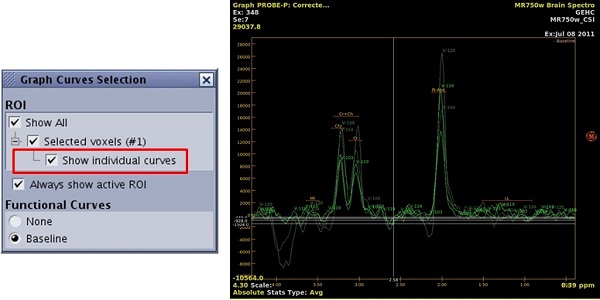
- Draw an ROI or copy/paste an existing ROI on the localizer image and the corresponding spectrum is displayed in the graph view. For more details, see 2D ROI procedure and 3D ROI procedure.
- All ROI types are supported.
- To change the spectrum appearance, click the yellow graph annotation and select a different graph view.
Figure 6. Yellow-annotation spectroscopy menu 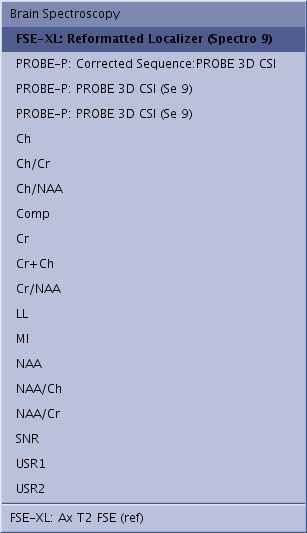
- To manipulate the localizer viewport, place the cursor over the image, right-click and select an option from the menu. The following are specific for a spectroscopy protocol.
- Show/Hide PRESS box toggles the white press box on and off.
Figure 7. Show press box (1), Hide press box (2) 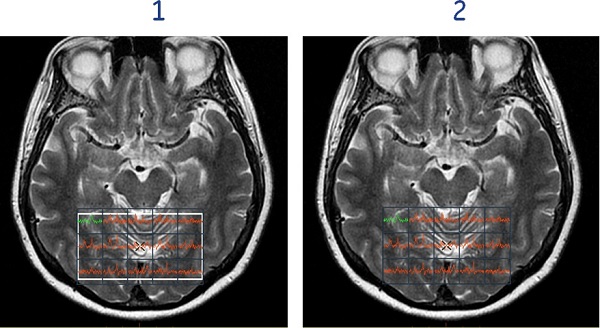
- Show/Hide sat bands toggles the SAT bands on and off.
Figure 8. Show SAT band (1), Hide SAT band (2) 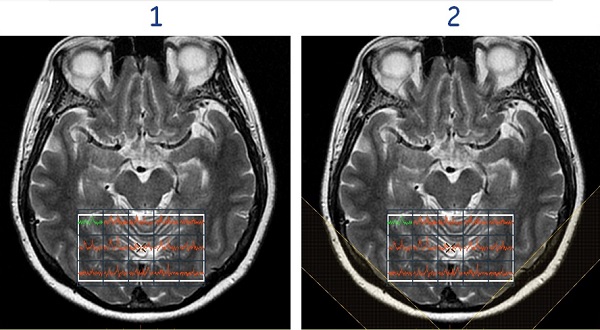
- Show/Hide Spectroscopy voxels toggles the spectrum within each voxel on and off.
Figure 9. Show Spectroscopy voxels (1), Hide Spectroscopy voxels (2) 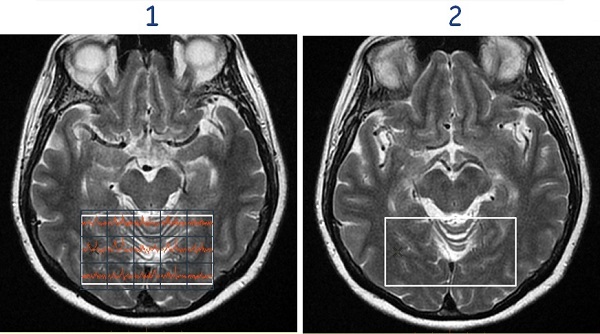
- Show/Hide Structural View toggles the spectrum and the voxel numbering within each voxel on and off the image.
Figure 10. Show Structural View (1), Hide Structural view (2) 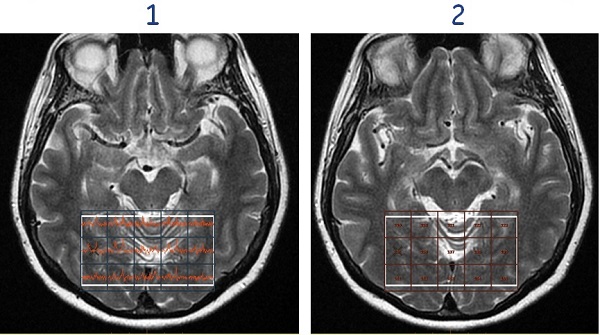
- Show/Hide PRESS box toggles the white press box on and off.
- To modify the localizer image, complete this workflow:
- Right-click in the desired viewport and select Set as spectro localizer.
Figure 11. Set as Spectroscopy Localizer menu 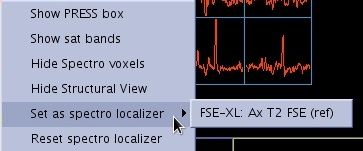
- Select one series from the menu. If the localizer volume you select has multiple phases, follow these steps:
- First select the desired phase/rank on the active image annotation.
Figure 12. Active phase/rank annotation adjusted on the image 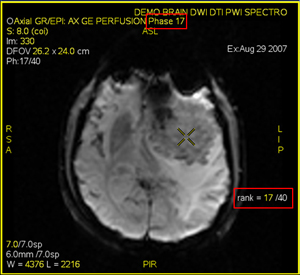
- Next, right-click in the viewport and select . The CSI grid appears on the new localizer with the desired phase and rank.
Figure 13. CSI grid displayed on specified phase/rank of volume 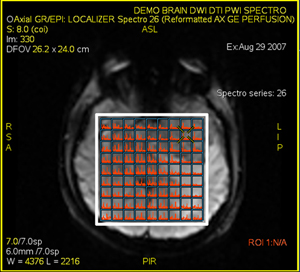
 Note, the compatible localizers displayed are the volume loaded at the opening of the session (functional volume, morphological volume). The volume computed during the session will not be available in this localizer list.
- First select the desired phase/rank on the active image annotation.
- Right-click in the desired viewport and select Set as spectro localizer.