

- 00000018WIA30085970GYZ
- id_400262011.2
- Mar 16, 2022 12:28:22 PM
Adjust voxel correction
About this task
Use these steps to remove the effects of the water peak tail and lipid general trend on a selected region of interest on a multi-voxel spectroscopy series.
- Use Phase Correction to flatten the spectrum baseline.
- Use Frequency Shifting to reset spectrum shifts for selected spectra or all spectra in the data set.
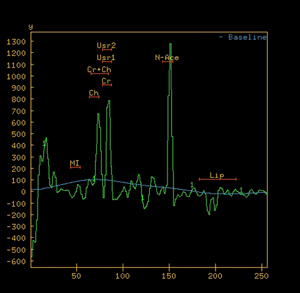
- Use the baseline correction to correct a wavy pink line baseline. Baseline is defined by all points outside metabolite ranges. In other words, all data points that are not defined as metabolites are used to generate the baseline. The baseline is indicated by the blue line.
Typically, use the following steps if there is a visible change in the baseline, i.e. the blue line at the bottom of the spectrum indicating the metabolite width is not a straight line.
Each time a voxel is corrected, it appears in orange color.
These steps assume you have launched a spectroscopy series.
Step-by-step instructions
- From the Baseline Correction section, click Apply.
- You may chose to Apply the correction any time you alter the phase or frequency.
 Click Reset to change the individual values back to the factory settings or click Reset All to change all values on the Voxel Correction tab to the factory settings.
The top right side of the graph view, indicates voxel correction for the phasing shift, frequency shift and the baseline correction.
Figure 2. Note the peaks labeled and corrections made from the Voxel Correction tab are annotated in the upper right corner of the spectrum 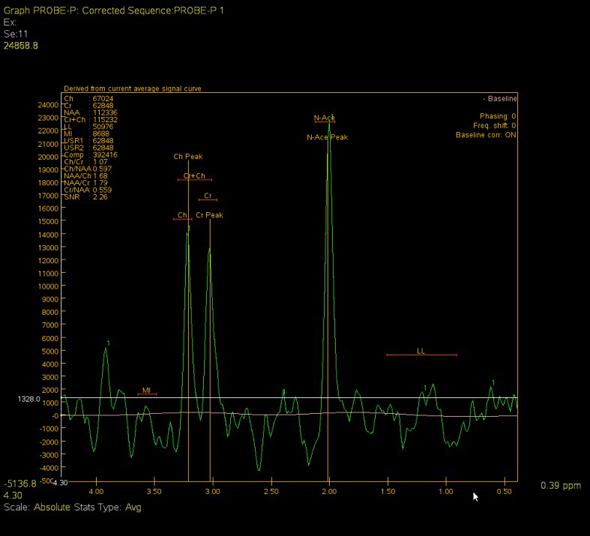
- You may chose to Apply the correction any time you alter the phase or frequency.