READY View computes a metabolite’s values using two different methods that may lead to differences when the values are displayed in the graph view or in the viewport.
About this task
Use these steps to deposit a 3D ROI on a spectroscopy image and view the corresponding spectrum.
Step-by-step instructions
Page through the 3D CSI data set and select the desired image.
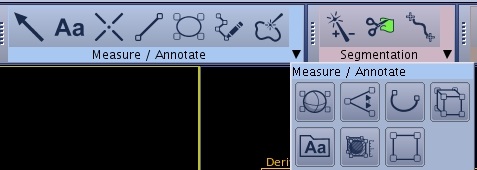
From the Measure/Annotate toolbar, select a 3D ROI cursor.
Figure 1. Measure/Annotate tool bar
Position the ROI within the spectroscopy voxels.
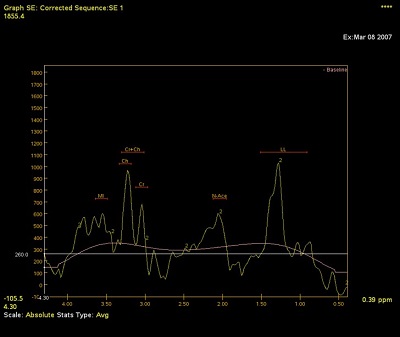
The corresponding graph reflects the average curve of voxels included entirely in the 3D ROI. If no entire voxel is included in the 3D ROI, the displayed graph corresponds to the voxel where the center of the ROI is located.
When displayed in the graph view, a metabolite’s values are derived from the average signal curve of all voxels included in the ROI. These values correspond to the values reported by the curve that is displayed in the graph view.
When displayed in the viewport, a metabolite’s values are first derived from the signal curve coming from each individual voxel included in the ROI. A metabolite’s values from all voxels are then averaged. These values correspond to the values reported by the metabolite’s maps.
Click the 3D ROI cursor center and move the ROI within the area of the highlighted spectroscopy voxels and note that the graph does not change.
The graph automatically registers when the ROI is moved outside the highlighted voxels.
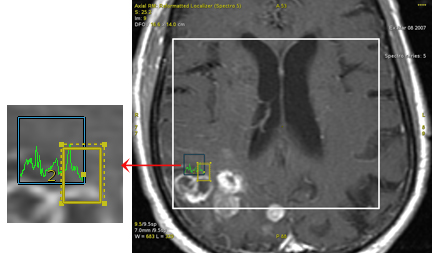
Table 1. 3D ROI positioned on spectroscopy image
3D ROI position
Corresponding graph
Figure 2. 3D ROI positioned at the top of the selected spectroscopy voxels