

- 00000018WIA308BC770GYZ
- id_400257831.4
- Apr 14, 2022 3:12:21 PM
Browser work area
From the header area of the screen, click the  to open the Image Management work area.
Scroll to the bottom of the graphic to see details.
The exact content of all the screen areas may vary based on your system configuration.
| Number | Description |
|---|---|
| 1 | Screen header area |
| 2 | Image Management Patient List controls |
| 3 | Image Management Patient List |
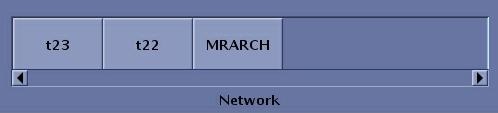
| 4 | Archive/Network destinations
|
| 5 | Screen footer area |
| 6 | Session Apps list 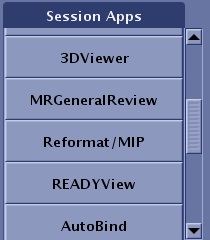 |
| 7 | Data Apps list 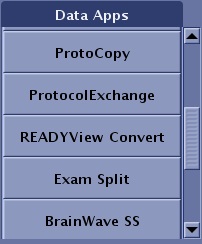 |
| 8 | Tools area 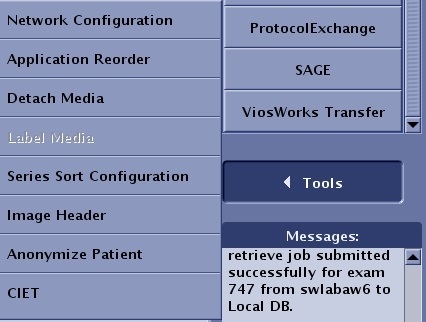 |
| 9 | Message area The Image Management message area displays messages related to archive, network, and image display.  |
| 10 | AutoView |
| 11 | Gating waveform or Protocol Notes area or Coil tab |
| 12 | SAR screen |

 appears above the button. Roll the cursor over the button and a tool tip appears indicating the available space on the device.
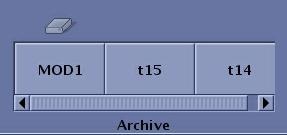
 opens the
  opens the