

- 00000018WIA30EBE770GYZ
- id_400245581.7
- Sep 6, 2022 5:09:09 AM
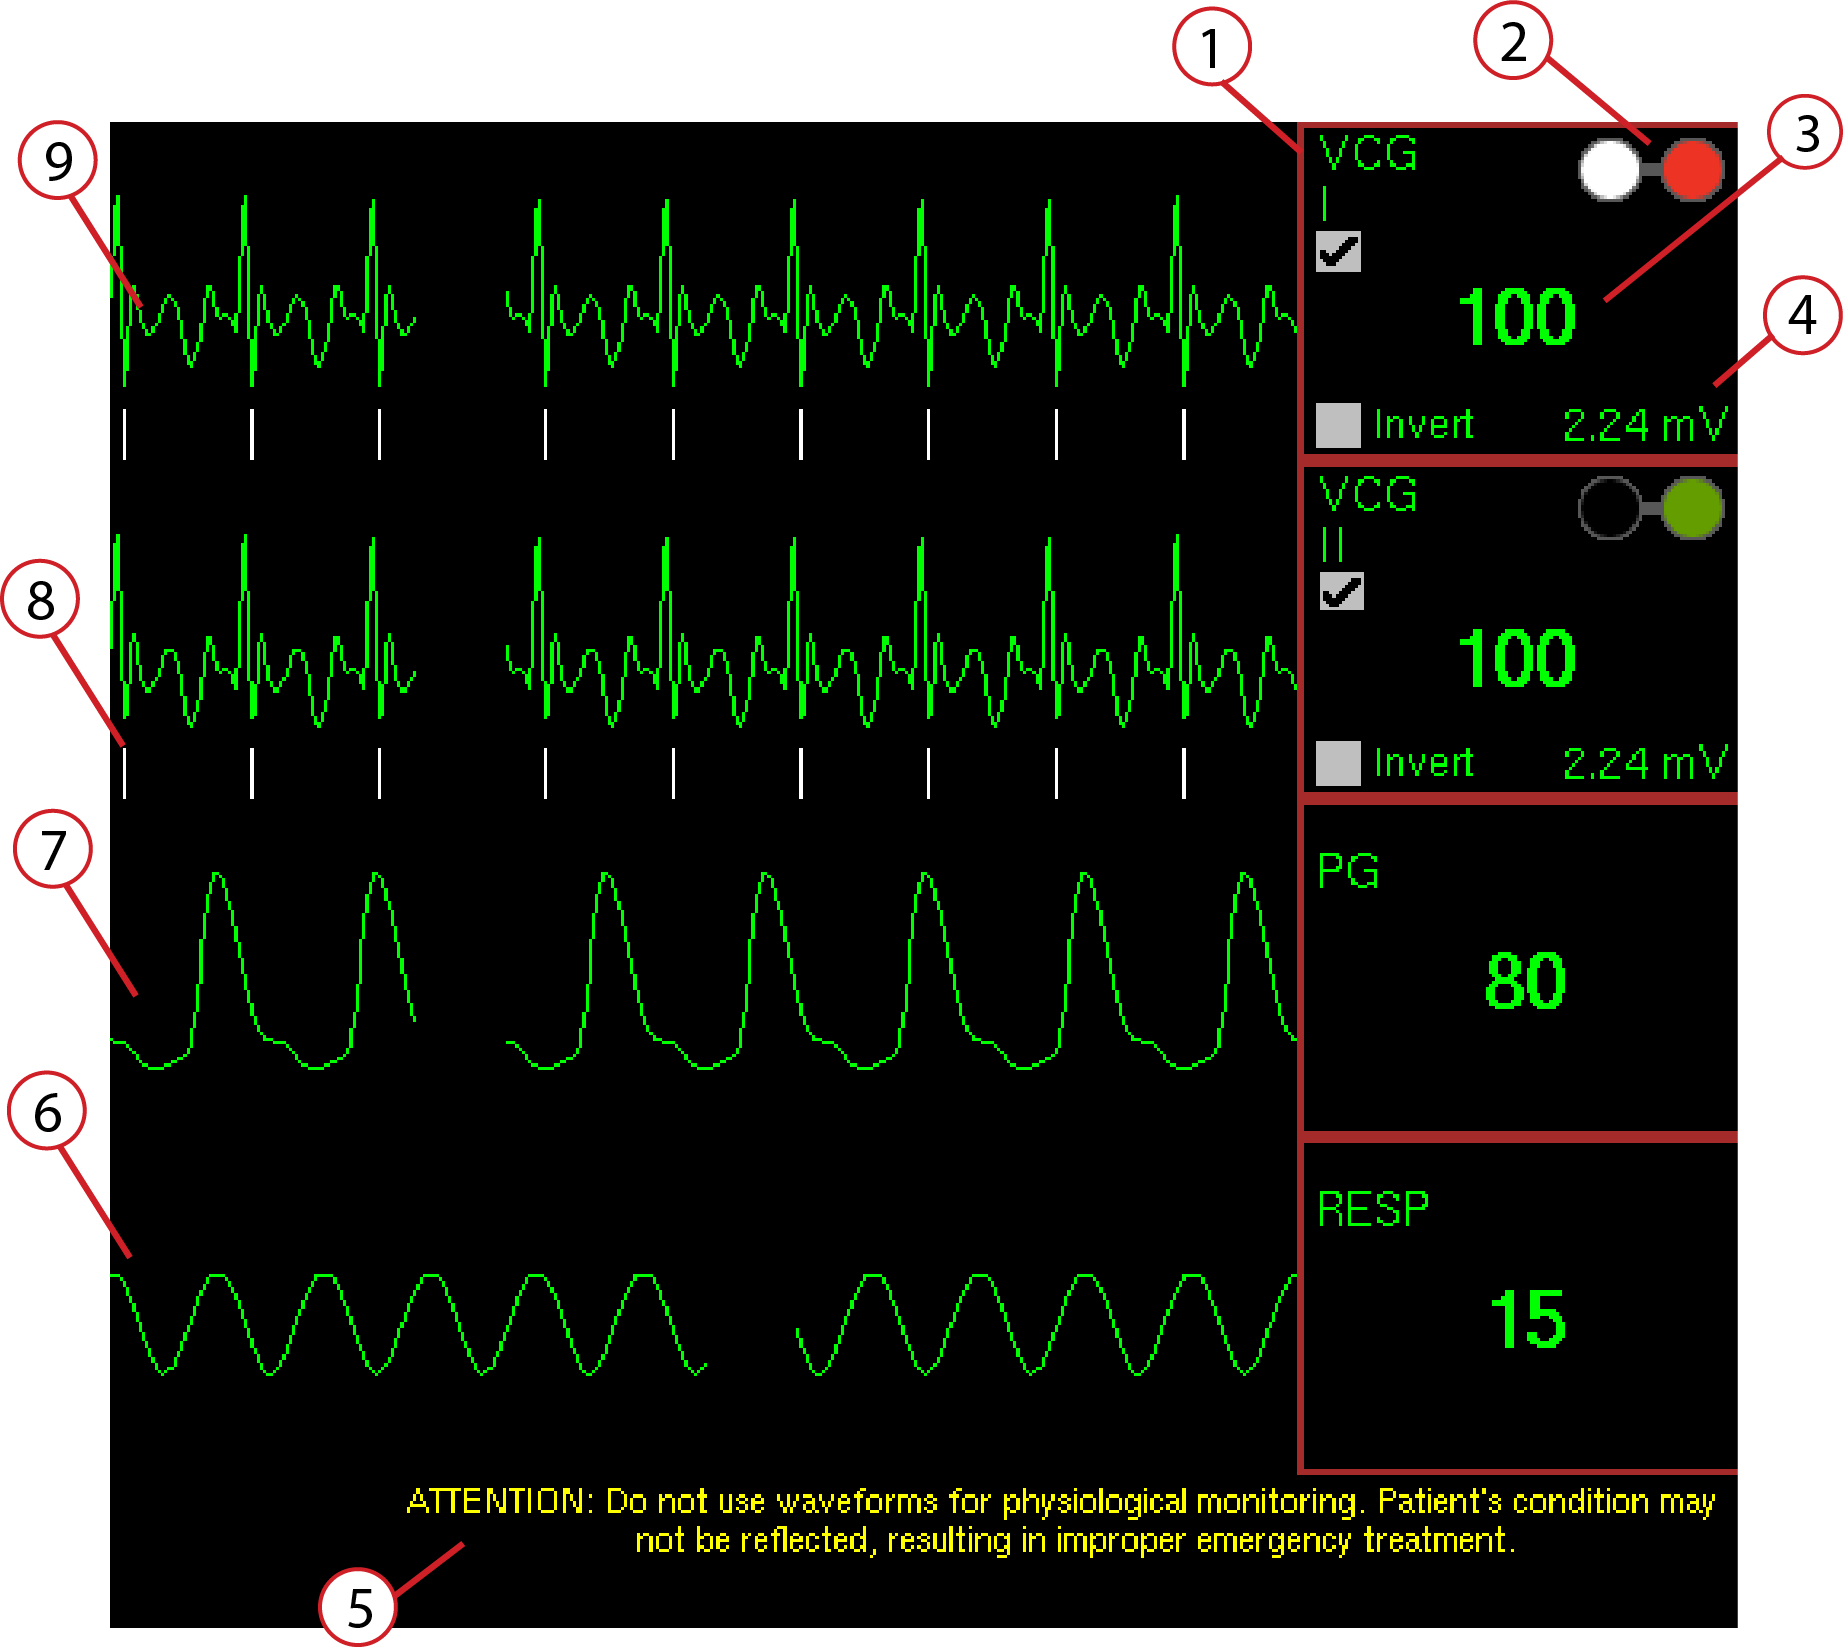
Waveforms tab
Click the Waveforms tab in the lower right corner of the monitor to view multiple waveforms simultaneously. The number of waveforms displayed is determined by the selections made from the Gating Control screen. The waveforms are automatically updated at set intervals.
| Warning | |
|---|---|
| Number | Item | Description |
|---|---|---|
| 1 | Trigger Lead selection display | This displays the trigger leads for the chosen cardiac trigger methods. The trigger lead options may change based on the chosen cardiac gating mode. |
| 2 | Electrode identification | The colors of the electrodes are displayed on the Waveform tab (white= RA, black=LA, green=RL, red=LL). For example, if you see a bad signal on VCGI, re-position the white and red electrodes. |
| 3 | Heart rate display | Displays a numerical value for the patient's heart rate in beats per minute. |
| 4 | mV display | Displays the amplitude of the ECG signal in real time; when it changes, the new mV value displays on the screen. If the mV value falls below 0.8 mV, it turns yellow. If the mV value falls below 0.4 mV it turns red. The recommended minimum is 1.4 mV. Typically, if the amplitude is below 1.4 mV, check to make sure the leads are properly connected to the patches, repeat the patient preparation procedure, and/or reposition the electrodes. In some patients (those with heart failure for example), it may be difficult to obtain an R-peak amplitude at the desired level of 1.4 mV. In these instances, it is important to note that gating success may be compromised. |
| 5 | Attention message | Message: Do not use waveforms for physiological monitoring. Patient’s condition may not be reflected, resulting in improper emergency treatment. |
| 6 | Respiratory activity | Patient respiratory acitvity is shown by the waveform and the respiratory rate is displayed numerically in breaths per minute. The respiratory waveform rises when the patient inhales and falls when the patient exhales. |
| 7 | Peripheral pulse | Patient peripherial blood flow activity is shown by the waveform and the cardiac pulse rate is displayed numerically in beats per minute. The peripherial waveform increases with increased blood flow. |
| 8 | Trigger marks | The triggering tick marks under the ECG and PPG waveforms indicate where the system is determining a cardiac trigger. The triggering level may be adjusted for the ECG Standard and PPG triggering methods. |
| 9 | ECG activity | Displays the two ECG waveform channels in real time. The waveforms may be inverted. |