

- 00000018WIA30FCE770GYZ
- id_400256571.3
- Jun 18, 2022 3:28:26 PM
ECG waveform
Electrical impulses cause the heart to contract and, therefore, blood to flow throughout the body. The electrical activity of the heart can be can be detected by measuring the voltage difference between electrodes attached to the patient. The voltage differences can be mapped by an ECG and the resulting ECG waveform can be used during cardiac gating/triggering to reduce pulsatile cardiac motion by synchronizing data acquisition to the cardiac cycle. The ECG gating devices are safe for patients due to the fiber-optic technology.
ECG gating can eliminate motion artifacts by using the heart’s electrical activity as reported by the ECG to trigger the data acquisition. It is useful during the following applications:
- Cine-PC imaging to examine flow
- Heart imaging for structure or function
- Thorax imaging
Use these steps to prepare your patient for an ECG gated cardiac examination. To perform a successful gated examination, it is very important to follow these steps for proper ECG lead placement and cable routing. Attach electrodes no more than 5 to 10 minutes before a scan.
The following are Type BF applied parts:
- ECG lead connector
- respiratory bellows connector
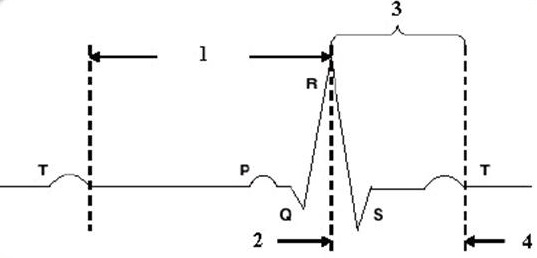
The ECG waveform represents the electrical activity of the heart that correlates to the following heart motion: cardiac contraction called systole, and cardiac relaxation called diastole. The figure below displays a normal ECG pattern of the waves in the cardiac cycle.
| Number | Description |
|---|---|
| 1 | Diastole
Cardiac relaxation is called diastole. Diastole is the period between the end of the T-wave and the peak of the following R-wave. It is during diastole that the ventricles fill with blood. |
| 2 | End diastole
There is a difference between electrical diastole and mechanical diastole. Electrical end-diastole occurs at the P-wave. Mechanical end-diastole occurs at the R-wave. The figure above shows mechanical end-diastole. Mechanical diastole is used in cardiac imaging. |
| 3 | Systole
Cardiac contraction is called systole. Systole is the remaining portion of the cardiac cycle after the R-wave. It is the period between the R-wave’s peak and the end of the T-wave when the heart is contracting and expelling blood. |
| 4 | End systole |
| P-Wave | Represents depolarization of the atria, resulting in contraction or systole of the atria. A normal P-wave is no more than 3 mm high and 0.12 seconds in duration. It is difficult, and sometimes impossible, to see the P-wave on an ECG acquired when the patient is in the bore of the magnet. This contraction is not normally seen in FastCard acquisitions, due to the application of the Trigger Window. |
| PR interval | Represents the time between the onset of the P-wave and the onset of the QRS complex. The normal duration of a PR interval is 0.12 to 0.20 seconds. Anything greater than 0.20 seconds is abnormal. |
| QRS Complex | Represents depolarization of the ventricles, resulting in contraction or systole of the ventricles. The normal duration of a QRS complex is about 0.08 to 0.11 seconds. A longer complex may indicate a ventricular conduction defect, such as a left bundle branch block. |
| ST Segment | Represents the time between the completion of a depolarization and the beginning of repolarization of the ventricle. An elevated or depressed ST segment could indicate ischemia or an infarction. |
| T-wave | Represents re-polarization of the ventricles, resulting in relaxation or diastole of the ventricles (recovery phase after ventricular contraction). Flowing blood in the body makes an artifact in the ECG that obscures the normal T-wave when the patient is inside the magnet, rendering the ST segment invalid for evaluation of infarction or ischemic events. In cases of heart injury, the T-wave may be inverted. |
| RR interval | Represents the time between one heartbeat and the next, based on the R-wave of the QRS complex. Each RR interval corresponds to a full cardiac cycle. The R-wave is used for triggering because of its strong electrical signal and correlation of the muscle activity of the heart. |