- 00000018WIA30BDF770GYZ
- id_400268511.3
- May 23, 2022 6:26:30 AM
Generate a histogram graph
About this task
Use these steps to generate a histogram graph that shows the percentage of occurrence of each voxel value, either in a user-defined surface area on a reformatted slice (cross-section histogram) or in the entire 3D object (volume histogram).
Step-by-step instructions
- On the histogram graph, click and drag the green dashed line to adjust the threshold.
Figure 1. Example of Click and drag threshold dashed lines to encompass anatomy of interest 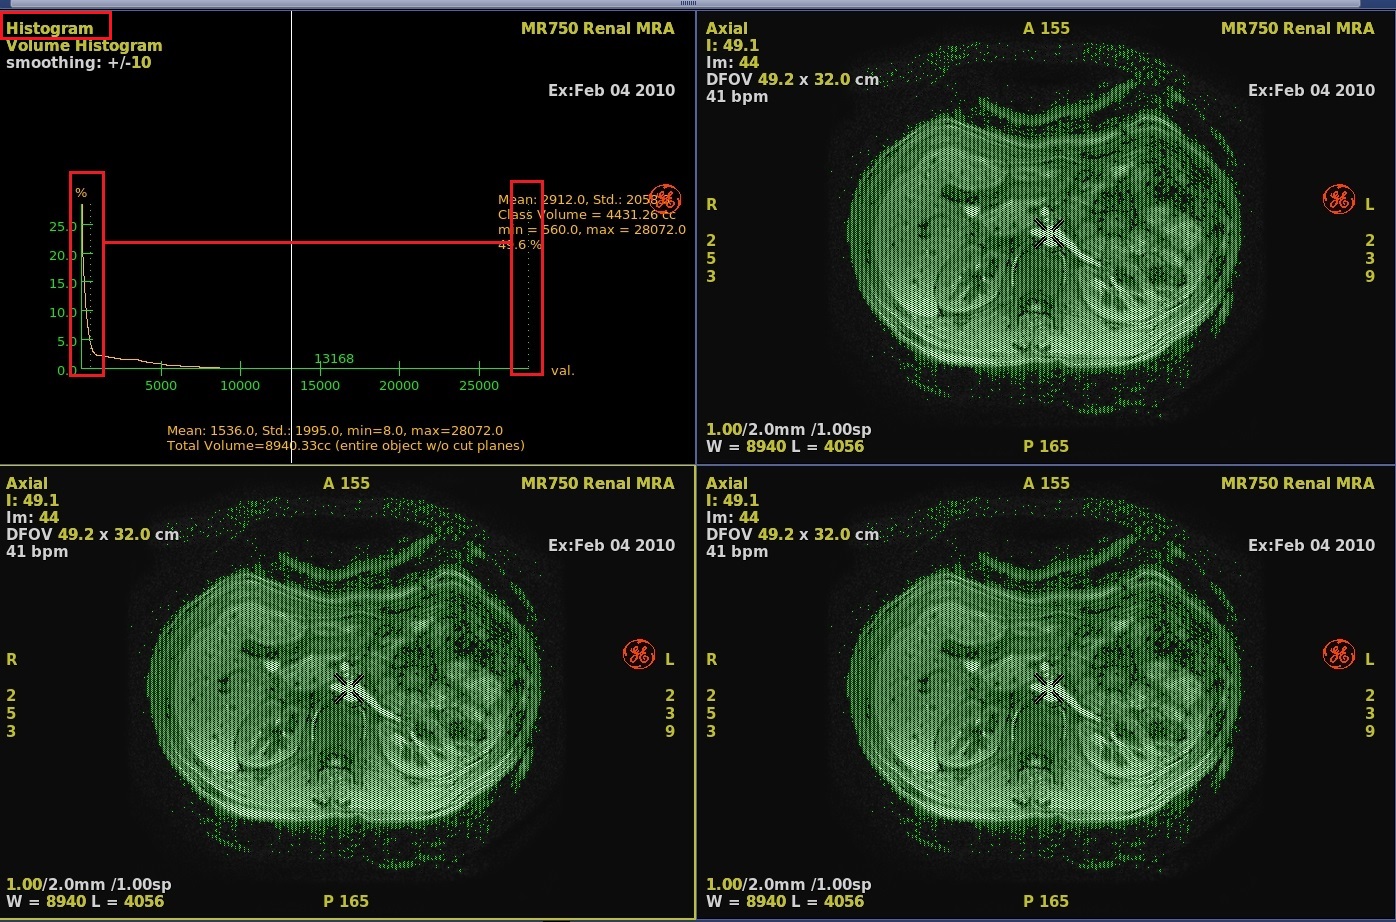
Figure 2. Example of Threshold narrowed 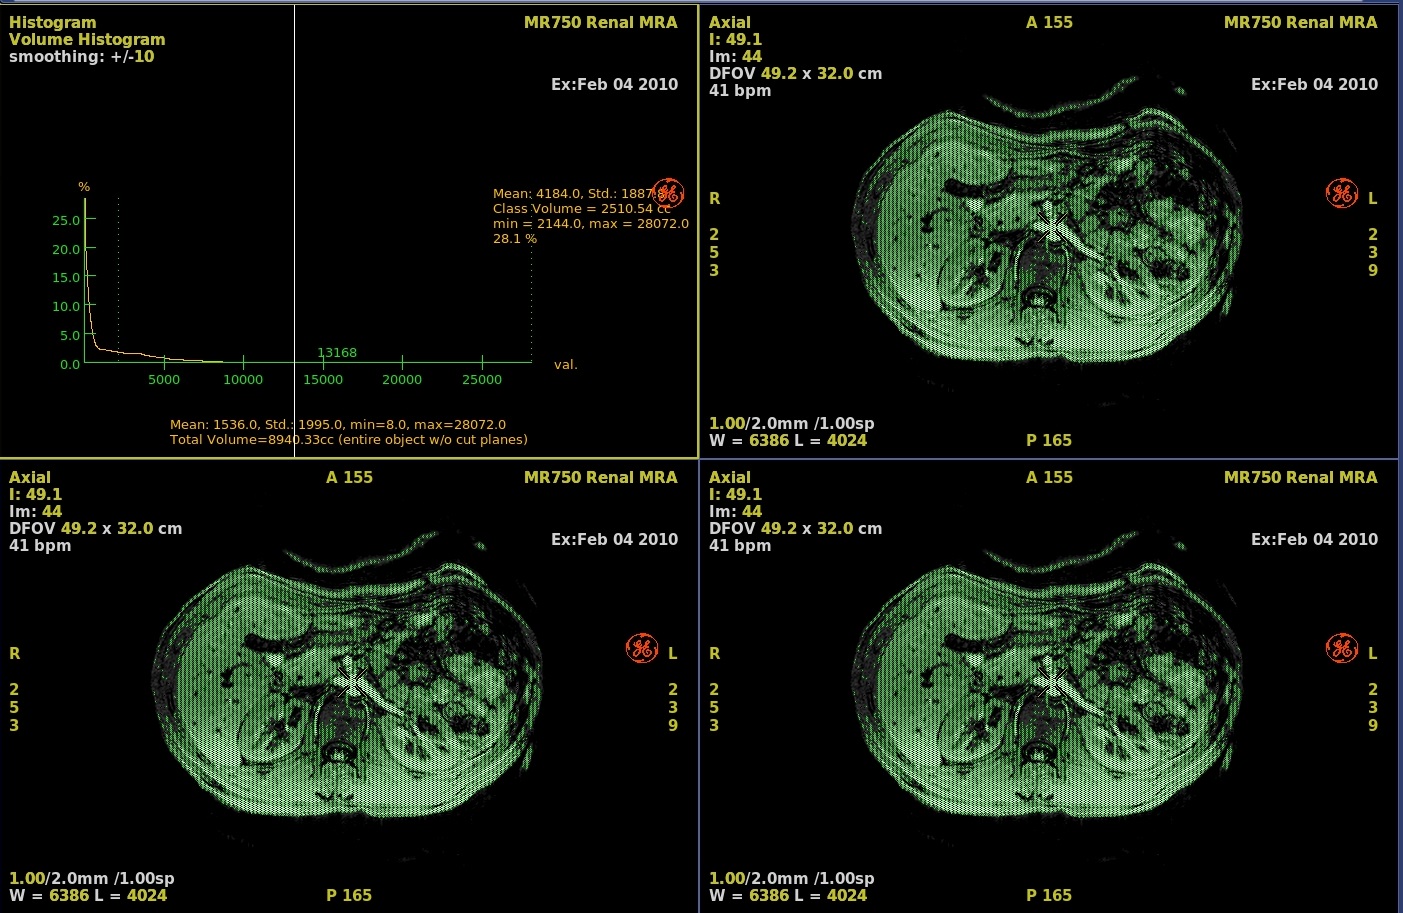
- To view an ROI Histogram, complete the following steps:
- From the Measure Annotate toolbar area, select a 2D or 3D ROI.
- Click the viewport of interest and deposit the ROI.
- Position and size the ROI. For details, see Modify ROI procedure.
- Click the active Volume Histogram and select Show ROI Histogram.
Figure 3. Example of ROI histogram 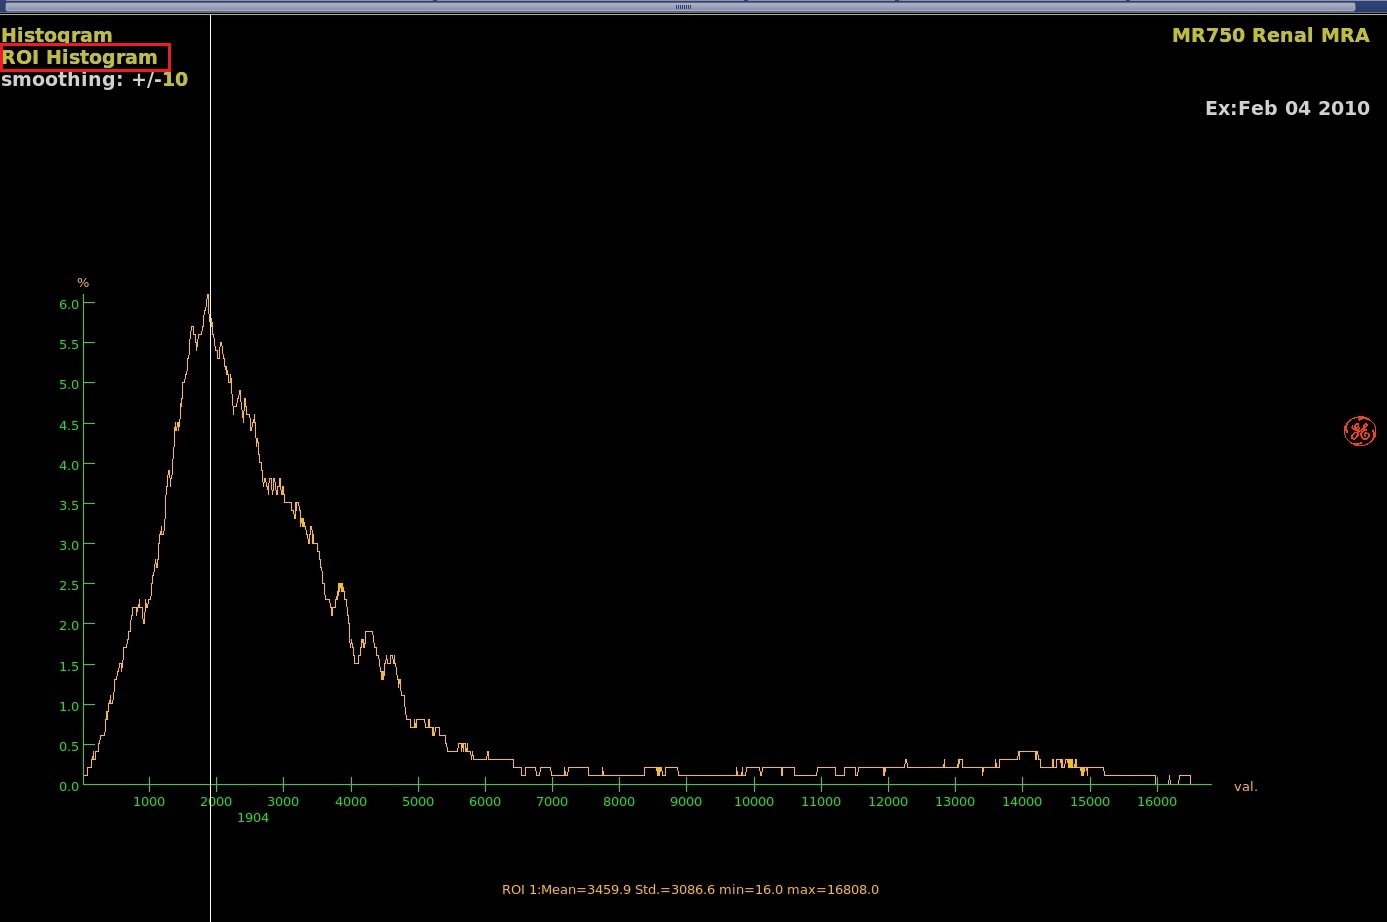
- Click the Active Volume Histogram and select Show Volume Histogram view, move the voxel reference line to select a class of voxels.
- On the histogram graph, click and drag on the voxel reference line (solid white line) to the area of interest.
Figure 4. Example of Volume histogram 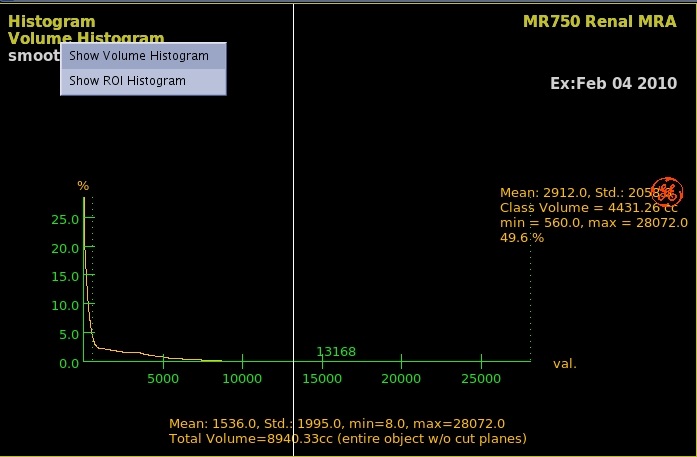
- On the histogram graph, click and drag on the voxel reference line (solid white line) to the area of interest.
- To define a cross section follow these steps.
- Cross-section is only available once you have defined an ROI histogram.
- From the view type active annotation, select X-Section.
- In the viewport containing the anatomy of interest, press Shift and simultaneously click to deposit points around the area of interest.
- Move the voxel reference line to select a class of voxels.
- On the cross-section graph, click and drag on the voxel reference line (solid white line) to the area of interest.
- On the cross-section graph, click and drag the green dashed line to adjust the threshold.
Figure 5. Example of Cross-Section 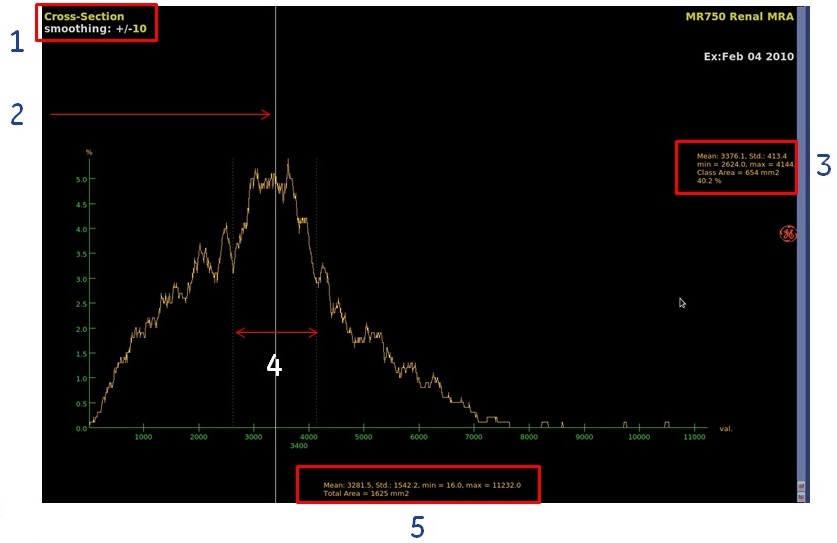
Table 1. Image legend Histogram annotation Description 1. Smoothing annotation The smoothing annotation indicates how the percentage of occurrence values are calculated. If the smoothing value is 0, each percentage-of-occurrence value on the histogram's vertical axis is calculated directly for each voxel value on the histogram's horizontal axis. If the smoothing value is 10, a range of +/- 10 is taken around each voxel point on the histogram's horizontal axis. The values are averaged and this average value is attributed to the voxel point on the histogram's horizontal axis, creating a smoothing effect on the histogram curve. Increasing the smoothing value will tend to even out the histogram and small peaks and valleys will tend to disappear, thereby changing the class boundaries.
The software takes this value into account when determining the class boundaries.
Use the active annotation to change the smoothing value.
2. Voxel reference line Move the voxel reference line to select a class of voxels. 3. Voxel class statistics A voxel class refers to a range (class) of voxels whose values are specific to a certain anatomical feature (e.g. bone surrounded by muscle, or a tumor surrounded by healthy tissue). 4. Class boundaries 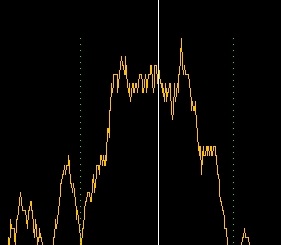
Class boundary lines located on both sides of the center white line, mark the upper and lower limit of a class (range) of voxel values around the voxel reference line whose values are specific to a certain anatomical feature (e.g. bone surrounded by muscle, or a tumor surrounded by healthy tissue). These boundaries are calculated automatically and displayed as green thin dotted lines. You can move them manually to delimit an exact range of voxel values. The software analyzes the peaks and valleys of the histogram curve and determines the voxel class around the current voxel reference line from the changes in slope (the inflection points) of the histogram curve. Set the smoothing value as required before using the class boundaries.
Automatic: Position the voxel reference line on the histogram at the desired voxel value.
All voxels within the class are displayed in green on all views of the object for as long as you hold down the Shift or mouse button.
Manual: To modify the class boundaries manually, click and drag on them. The voxels corresponding to the class are displayed in green on all views, and remain so even after releasing the mouse button (to change the views back to normal, return to automatic mode by clicking on the voxel reference line or pressing Shift).
5. Statistics Statistics about the voxel values (mean, standard deviation, maximum, and minimum) within the class defined by the boundary lines, and the computed value of the corresponding surface area or volume.
- Cross-section is only available once you have defined an ROI histogram.
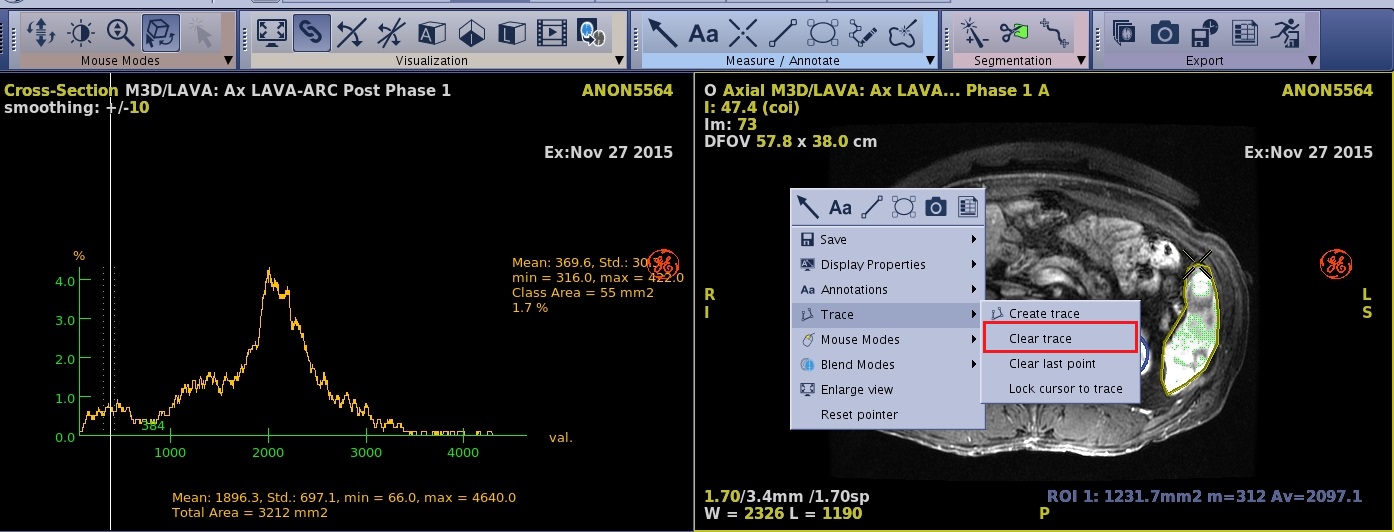
- To delete a trace so that you can create a new trace with a new histogram, follow these steps.
- Place the cursor in the viewport that has the ROI trace.
- Click the ROI trace to make it active.
- Right-click to view a menu.
- Click Clear Trace.
Figure 6. Trace menu