

- 00000018WIA303EF770GYZ
- id_400229541.2
- Mar 10, 2022 11:53:18 AM
Generate a profile graph
About this task
Use these steps to generate a profile graph that shows the voxel value along a 3D trace (profile).
Step-by-step instructions
- Drag the voxel reference line to move the 3D cursor to the corresponding position on the trace.
- The reference lines shows the voxel value at the position of the 3D cursor.
- Mean (average voxel value along the trace) and Std. (standard deviation of voxel values along the trace) is displayed at the bottom.
Figure 1. Profile graph 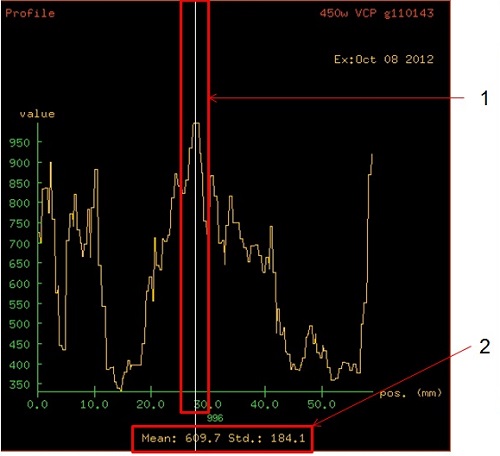
Table 1. Image legend Profile annotation Description 1. Voxel reference line Shows the voxel value at the position of the 3D cursor. Drag the voxel reference line to move the 3D cursor to the corresponding position on the trace. 2. Statistics The statistical information about the voxel values along the trace is displayed at the bottom of the profile view. The Mean = average voxel value along the trace and Std. = standard deviation of voxel values along the trace.