

- 00000018WIA303F3970GYZ
- id_400234341.2
- Aug 20, 2022 11:00:04 AM
GRE scan parameter selections
Use this information when selecting Gradient Echo scan parameters. For specific scan parameter values, select a protocol from your GE or Site library.
TR, TE, Flip angle
In GRE sequences, the TR and flip angle control the level of saturation. TE controls the level of dephasing and T2 contribution. For proper contrast weighting, refer to the following table to select your desired imaging parameters.
| Contrast Weighting | |||||
|---|---|---|---|---|---|
| Parameter | T1 | T2/T2* | PD | T1/T2 | |
| Sequential | TR | 200 or less | 200 or less | 200 or less | 20 to 50 |
| TE | min - 15 | 30 - 60 | min - 15 | min - 15 | |
| Flip Angle | 45 - 90 | 5 - 15 | 5 - 30 | 30 - 60 | |
| Non-Sequential | TR | 200 - 600 | 200 - 600 | 200 - 600 | |
| TE | min - 15 | 30 - 60 | min - 15 | ||
| Flip Angle | 45 - 90 | 5 - 15 | 5 - 30 | ||
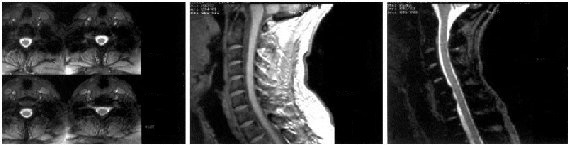
The images below demonstrate the different types of contrast available with the non-sequential GRE sequence, MPGR. Image A shows the proton-density effect associated with low flip angle MPGR. Note the myelographic effect between the CSF and the spinal cord. Also note the T2* effect on the vertebral bodies. In image B, the T1-weighting is obtained with large flip angle MPGR. Again, note the darkening of the vertebral bodies (T2* effect). Image C shows the T2 effect associated with long TE MPGR. These images display improved T2* contrast between the CSF and spinal cord, as well as severe darkening of the vertebral bodies due to these effects.
As a general rule, SNR within a GRE pulse sequence increases as:
- TR increases
- Flip angle increases
- TE decreases
TR and TE changes have a greater effect on SNR as compared to similar changes in SE sequences.