- 00000018WIA30F83970GYZ
- id_400235451.3
- Aug 19, 2022 5:22:50 PM
FSE scan parameter selections
Consider this information when modifying a Fast Spin Echo scan parameter. For specific scan parameter values, select a protocol from your GE or Site library.
- Fat Shift Direction standard scan parameter is used to define the display direction from fat signal. For details, see Fat Shift Direction.
ETL effects on image quality
ETL selection is an important consideration due to its effect on scan time, image contrast, SNR and number of slices per acquisition, blurring, and SAR.
Scan time
- Increasing the ETL directly decreases the scan time.
Image contrast
- Increasing ETL increases T2 effects for a long TR/long TE image due to the contribution from later echoes. Long TR acquisitions enhance myelographic effects, increase T2 weighting on pediatric brains, and yield proton density information for tissues with long T1 times (e.g., CSF).
SNR and Number of Slices per Acquisition
- The long TRs associated with FSE scans can be used to increase SNR, and increase the number of slices available. Increasing the TR increases the SNR, but only to a point. In neurological applications (brain and spine), for example, an increase beyond 6000 ms may not significantly increase the SNR for gray/white matter.
Blurring
- Filling k-space in this manner may degrade some images; most commonly by blurring in the phase encoding direction. This results from each line in k-space being taken at different echo delays, meaning that the tissue has a different amount of transverse magnetization due to T2 decay. The blurring decreases as the number of encodings is increased. It is practically unnoticeable at 512 phase encodings.
SAR
- Increasing the ETL or the number of refocusing RF pulses increases the SAR to the patient, which may limit the number of slices allowable for any given TR.
User CVs
- FSE images may exhibit a fine line artifact. The suspected cause of this artifact is production of an FID outside the FOV. Using an even NEX can decrease, and often eliminate, the artifact. If you are using an odd NEX value, then turn on the Enhanced Fine Line Suppression User CV. The following trade-off is the result of software modifications that have been made to reduce fine line artifact:
- If the FOV is ≤ 16 and the slice thickness is ≤ 5, then the ESP may increase and there may be fewer slices per acquisition.
- Extreme High Resolution Optimization User CV is available to reduce motion artifact caused by smearing artifacts.
- FSE T1 Optimization User CV
- Motion Sensitivity Reduction User CV
- Receiver Gain User CV
k-space
K-space is the amount of space which must be filled with information that can be mathematically manipulated (Fourier Transform) in order to form an image. How it is filled can have an impact on the appearance of the image. K-space can also be defined as raw data - the intersection of one phase encoded axis and one frequency encoded axis. It is where the spatially- encoded MR signals collected during the application of the frequency encoding gradient are placed.
Central lines, or views, of k-space generally refer to those that occur as a result of the low amplitudes of the phase encoding gradient. It is these central lines of k-space that contain the majority of signals. Acquiring the outer lines of k-space increases the spatial resolution in the image.
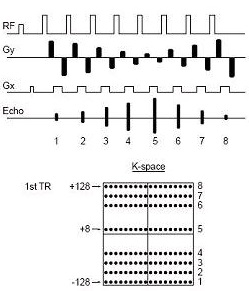
In an FSE scan, each echo is acquired with a different value of the phase encoding gradient, and therefore multiple lines of k-space are filled for each TR interval. For example, if 4 lines of k-space are filled with each TR , then the TR would have to be repeated only 64 times in order to fill k-space for a 256×256 scan (256 lines/4 lines-TR interval = 64 TR intervals). The associated scan time with this technique is 2 sec × 64 repetitions × 1 NEX = 2:13. In the FSE pulse sequence, the initial 90° pulse is followed by the acquisition of from 2 + echoes (the number of echoes based on the ETL selected in the protocol). The number of echoes selected is called the ETL and the time between each echo is called the ESP. Each echo is acquired with a different phase-encode gradient, meaning that for a 256x256 image, only 128 – 16 repetitions (TR) are needed to acquire enough information to create the image; if 16 echoes = 16 phase encodes, then 256 ÷ 16 = 16 repetitions.
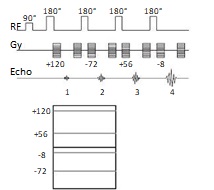
The middle lines of k-space are all acquired at the TE time (effective TE) selected by the operator. Remember that the middle lines of k-space are associated with the highest signals and, therefore, have the greatest impact on contrast. The outer lines of k-space (high spatial frequencies) have less impact on SNR, and less influence on contrast. If the central phase encodings (central lines in k-space) are concentrated around an 80 ms TE, the contrast will be most greatly influenced by the T2 decay consistent with that echo time.