

- 00000018WIA30CB1970GYZ
- id_400244391.3
- Mar 28, 2022 4:45:23 PM
T1 Map workflow
About this task
T1MAP is commercially known as CardioMaps.
Step-by-step instructions
- From the header area of the screen, click the Image Management icon (
 ) to open the Image Management work area.
 - From the browser, right-click and select T1Mapping.Note: There is a T1MAP inline task that can be added to T1MAP-SPGR or T1MAP-FIESTA, which performs the remaining steps. For details, see Add post-process task.
Result
The T1 Map review step in READY View is launched.- The left viewport displays the T1 Map from the acquisition (T1MAP - SPGR or T1MAP - FIESTA).
- The right viewport displays the T1 map for the same image.
Figure 1. T1 Map review step in READY View screen 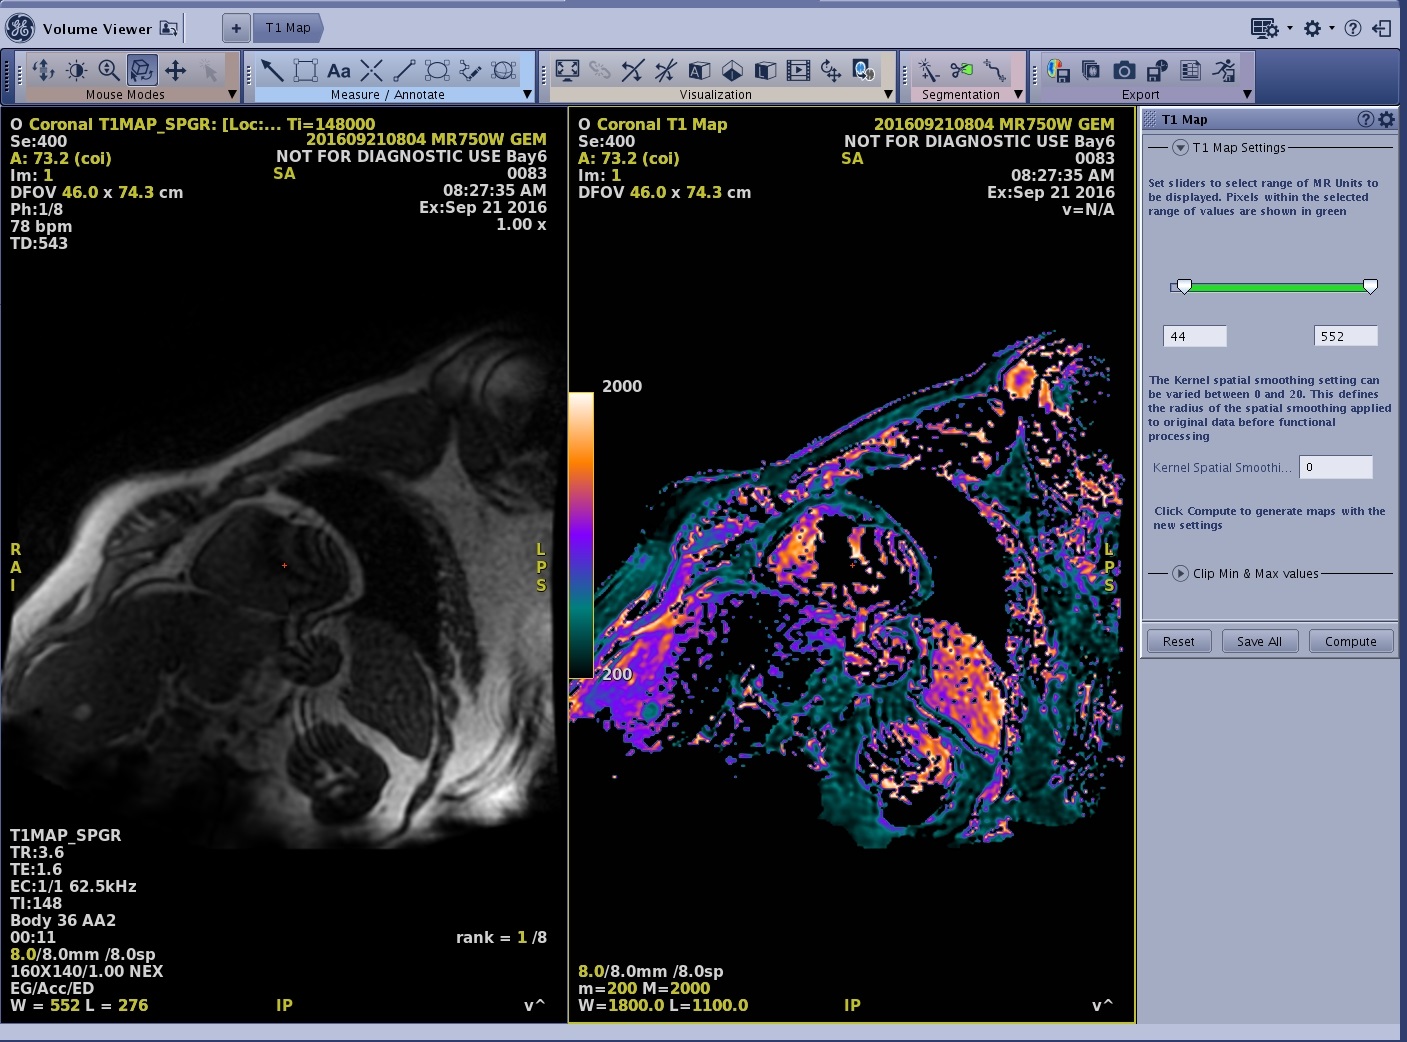
- Locate the area of interest.
- To view a particular TI or phase time that optimizes image contrast, click the TI or phase active annotation located at the top of the viewport and select a TI time from the menu.
Figure 2. TI time menu for T1 MAP SPGR or FIESTA with IR Prepared 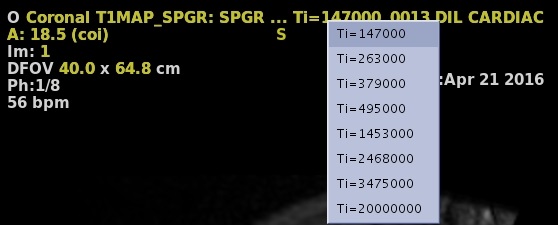
Figure 3. Phase time menu for T1 MAP SPGR or FIESTA with SR Prepared 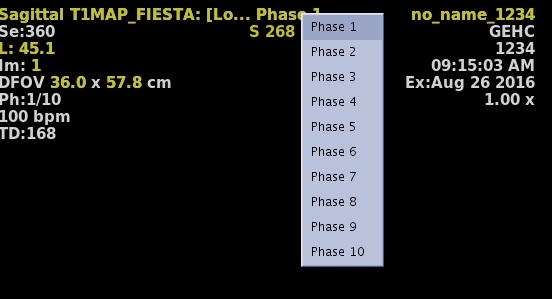
- For more image selection details, see Scroll through the images.
- To view a particular TI or phase time that optimizes image contrast, click the TI or phase active annotation located at the top of the viewport and select a TI time from the menu.