When MR SER launches, the source image, maps and a time/intensity curve display. The map viewports do not display image maps until the pre-post image ranges are defined and computed. A message displays communicating this information. The image/graph displayed in each viewport is based on the selected protocol.
Locate images that best demonstrate the automatic vessel detection.
From the SER screen, click and drag the left threshold slider until the anatomy is outlined in green and all the anatomy inside the image displays green lines.
The threshold value is the signal intensity value that will be used to mask out the background noise so that only the desired tissue is used in the map calculations.
When using the Algorithm for Enhancement Integral maps, consider that changing the Lower Threshold results in a re-compute. Releasing the lower threshold slider at a chosen value automatically triggers the compute. Changes to the Higher Threshold does a dynamic update to the Functional Maps based on the threshold mask since a re-compute is not necessary.
Note: Compute does not update the threshold. As the upper or lower slider is moved or a value entered in the text box, the threshold automatically updates.
To view a signal intensity/time curve from an ROI, complete the following steps:
From the Measure/Annotate toolbar, click a 3D ROI icon.
Place the cursor in an image viewport and left-click to deposit the ROI. The time/intensity curve displays.
Click and drag the ROI to an area of abnormal tissue.
Adjust the size and position of the ROI so that it fits within the pathology. For more details, see Modify measurements.
If need be, magnify the image by placing the cursor over the active DFOV text in the upper left corner of the viewport and middle-click and drag to size the image.
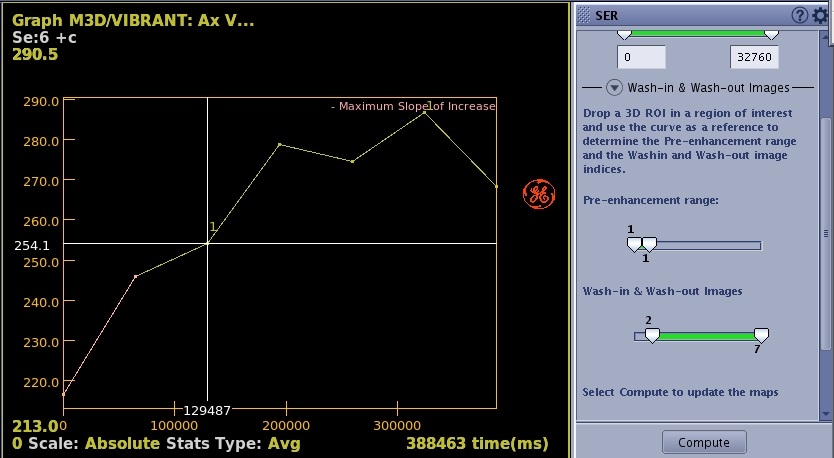
From the SER screen, click the Wash-in and Wash-out Images arrow to define the image range.
The pre–enhancement, wash–in and wash–out image numbers determine how the images will be processed. Use the sliders on the panel together with the curves on the graph view to set the pre–enhancement image range and the wash–in and wash–out images.
The pre-enhancement image range is used by the software to define a baseline. The pre-enhancement image range is defined as the range from the first to the last pre-enhancement image.
The wash–in image corresponds to the peak of the contrast uptake.
The wash–out image corresponds to a delayed time point when tissue has enhanced significantly and some wash–out has occurred.
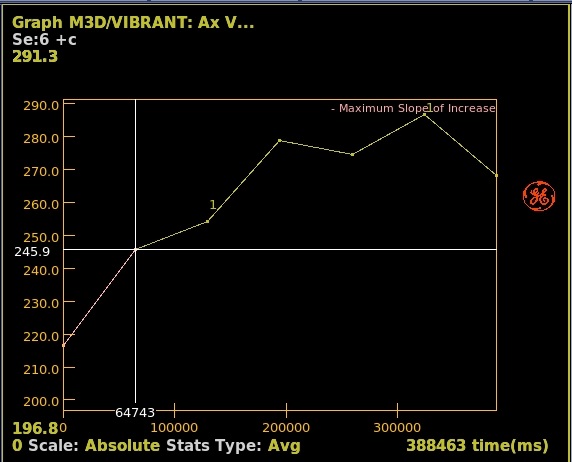
Click and drag the pre-enhancement slider to define the range of images before contrast arrives as displayed on the time/intensity curve. Figure 1. Range that defines pre-enhancement
Click and drag the Wash-in & Wash-out slider to define the contrast uptake and wash-out.Figure 2. Range that defines wash-in and wash-out
Click Compute to generate the image maps.
Ensure that the enhancement ranges are set correctly before computing functional maps in the SER protocol.
From the SER screen, click the Clip Min & Max values arrow and modify the minimum and maximum values for a selected parametric image.
From the SER screen title bar, click the Tools icon ().
From the SER screen, click the SER - Advanced Settings arrow and select an algorithm threshold or change the Kernel Spatial Smoothing.
As the kernel size increases, voxel averaging occurs and the image maps appear smoother.
The default algorithm threshold is 10.
The Kernel spatial smoothing default value is 0.
If you change a parameter, click Compute to generate maps with the new settings.
Change the desired settings.
Click Compute to generate updated maps.
Reset changes the selections to the factory default values.
Save All saves your selections as the new default values.
From the SER screen, click the SER - Final Settings arrow and review the settings. If you want to change any of the settings, click the appropriate selection from the MR SER screen. Click Compute to generate updated map.


 ).
). ).
).