

- 00000018WIA30E51970GYZ
- id_400238951.4
- Mar 28, 2022 4:24:54 PM
MR-Touch workflow
About this task
Step-by-step instructions
- Select the MR Touch Review review step.
The wave image is displayed in the upper right viewport.
Figure 1. Review steps for MR-Touch option 
- To visualize wave propagation across the acquired slice, complete the following.
- It is a good practice to display the wave images in a movie loop and make sure that the waves are propagated in the measurement area before you draw an ROI.
- The data quality is good if the waves are well seen, and propagate through the area of interest.
- From the visualization tool bar, click the Cine icon (
 ).
). - From the Cine screen, click the controls to start/pause or advance one frame at a time.
- Click the X in the upper right corner to close the Cine screen.
Figure 2. Example of Cine screen 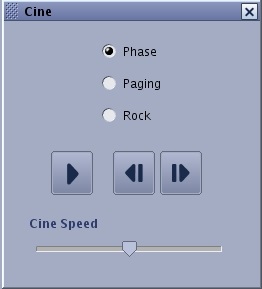
- To create a movie loop to export, see Export a movie.
- From the visualization tool bar, click the Cine icon (
- Follow these steps to draw an ROI to measure relative stiffness.
- From the measure/annotate toolbar, select the Freehand ROI icon (
 ).
). - From a mask image, draw an ROI in the non-masked area in the liver.
Figure 3. ROI drawn on mask image 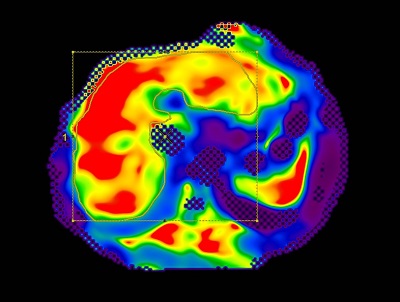
- Hot spots (areas of bright signal intensity) may occur adjacent to where the active driver is placed. Do not include these areas in your ROI.
Figure 4. Example of a hot spot 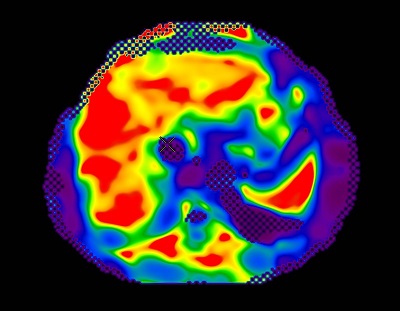
- Hot spots (areas of bright signal intensity) may occur adjacent to where the active driver is placed. Do not include these areas in your ROI.
- Copy/paste the ROI to an anatomic reference image and edit the ROI. For ROI edit details, see Modify measurements.
Figure 5. ROI copy/pasted to an anatomic reference image 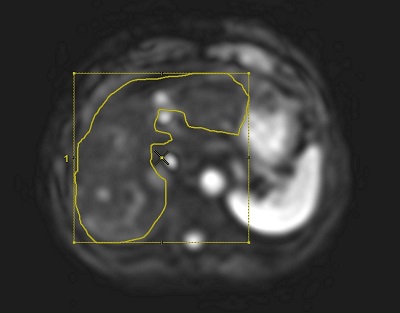
- The ROI should not contain any large vessels.
- The ROI should be drawn on regions with clear wave patterns.
- It is recommended that you draw the ROI at least half a wave length from the edge of the liver, and a wave length away from the upper-dome of the liver.
Figure 6. Note that the ROI is one wave (in this example, the first wave is blue) away from the surface of the liver and does not include any masked regions. 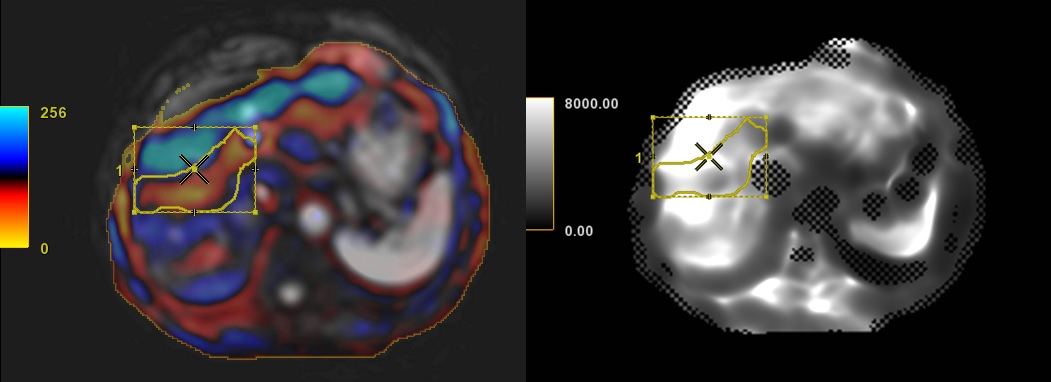
- Copy the edited ROI from the anatomic image and paste it onto the gray scale non-mask image.
Figure 7. ROI copy/pasted from a reference to gray scale non-mask image 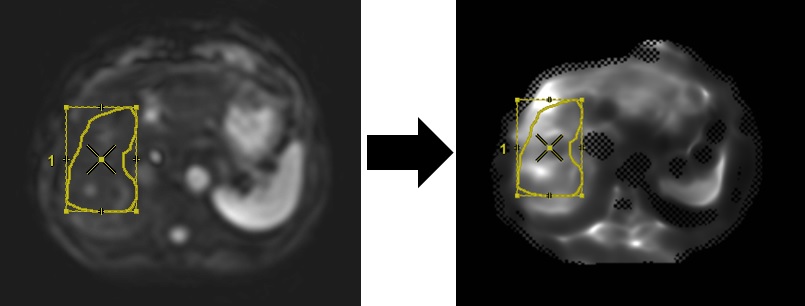
- Repeat this step for each ROI on other slices, as needed.
Important: The masked regions or checker box areas indicate the wave propagation was not sufficient to confidently generate stiffness contrast. Including masked (checkerbox) areas in your ROI will skew the ROI statistics. Failure to place the ROI as described will negatively impact the output measurement.
- From the measure/annotate toolbar, select the Freehand ROI icon (