To change DWI settings, make a selection from the desired ADC screens.
Step-by-step instructions
The threshold can be improperly set with the auto launch of DWI in READY View, therefore adjust the threshold accordingly. From the ADC screen, click and drag the left threshold slider until the brain is outlined in green and all the anatomy inside the image displays green lines.
Note: Compute does not update the threshold. As the upper or lower slider is moved or a value entered in the text box, the threshold automatically updates.
If needed, from the ADC screen, click the preprocessing arrow and click EPI correction. It is not necessary to click Compute.
If the DWI scans are acquired with multiple b-values, there are two locations from which you can make a b-value selection.
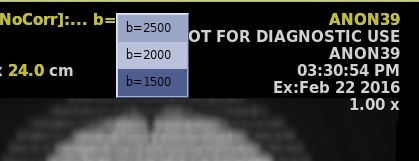
From the b-value active annotation, select an option from the menu.
Figure 1. B-value selection
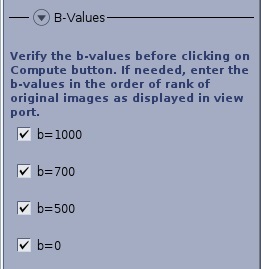
From the ADC, B-Values menu.
Figure 2. B-value menu on ADC screen
A typical diffusion-weighted exam is composed (for each scan location) of one averaged diffusion-weighted image for a gradient strength of b = 1000 sec/mm2, followed by the reference T2* image (b = 0) and three acquisition images. However, the protocol allows for data sets organized differently, or using a different gradient strength, or containing images for more than one gradient strength (b-value).
Selection of b-values provides for an accurate ADC maps by rejecting very high b-values from ADC computation when they are present in the exam. ADC should be calculated from data with a b-value around 1000, and not from higher b-values. High b-value images are useful clinically, but should not be part of the ADC calculation.
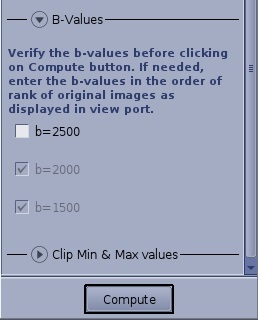
If there are 3 or more b-values, un-check the boxes for the b-values you don't want used in the computation. At a minimum, at least 2 b-value check boxes must be selected. If there are only 2 b-value check boxes, they are grayed out so that you cannot de-select either one of them.
Figure 3. Example of three b-values, where one has been de-selected resulting in the other two automatically selected
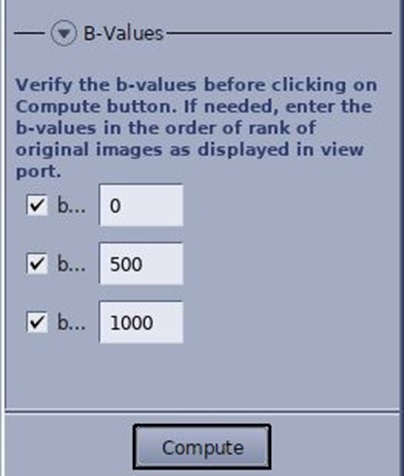
If dataset is from a non-GE MR scanner, you must type and enter the b-values in the text boxes and check the boxes, even if there are only two b-values.
Figure 4. Example of B-Values menu if the data set is from a non-GE MR scanner
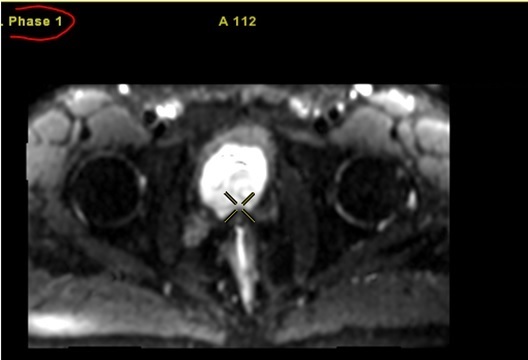
The b-values are from the scanned data set and it is imperative that those values are entered into the text boxes. If you view the non-GE images on you GE MR scanner, the b-value may not appear annotated as a b-value. In the following image, the b-value is annotated as a Phase number, and thus you must get the b-value from some other source than the image annotation. Figure 5. Non-GE image b-value annotation
From the ADC screen, click the Clip Min & Max values arrow to modify the minimum and maximum values for a selected parametric image.
From the ADC screen title bar, click the Tools icon ( ).
From the ADC screen, click the ADC- Advanced Settings arrow to change the confidence level or Kernel Spatial Smoothing.
The ADC algorithm uses a linear regression analysis to compute ADC. The ”confidence level” indicates how well the final result fits the data: a small value corresponds to high confidence and a large value corresponds to low confidence. You can set a confidence level threshold: pixel locations for which the algorithm returns a confidence level above the threshold are displayed in black on the functional map. For data sets with only two b-values (0 and 1000 sec/mm2) the confidence level is meaningless; it is always possible to obtain a perfect fit of a linear function between two points. However, for data sets with more than two b-values, the confidence level parameter can be used to eliminate noise areas. By default, the protocol uses a confidence level of 1% (0.01). It is suggested to use a confidence level of 25% (0.25) when there are more than two b-values.
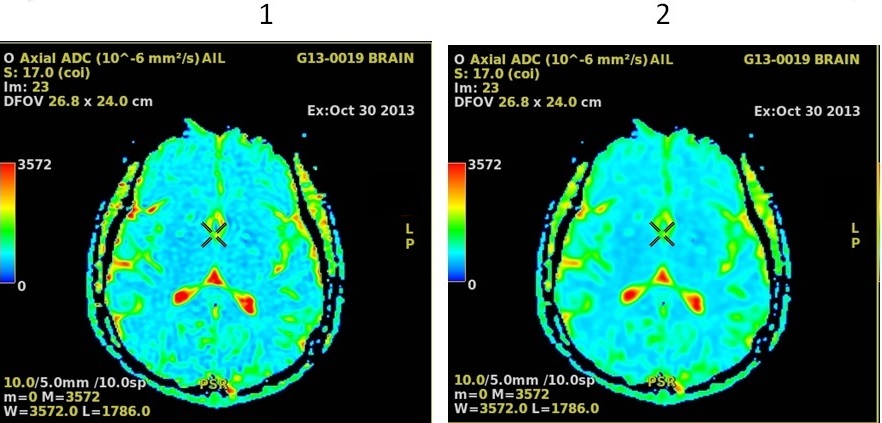
As the kernel size increases, voxel averaging occurs and the image maps appear smoother. The range is 0-20, where 0 means that no smoothing is applied. Figure 6. DWI post process maps: 1 = Kernel Size is 0, 2 = Kernel size is 2
The Confidence Level default value is set at 0.01, which means a 99% confidence level for the displayed data. The entered value can range from zero to 1, and as it gets closer to zero, the confidence level increases.
Change the desired settings.
Click Compute to generate updated maps.
Reset changes the selections to the factory default values.
Save All saves your selections as the new default values.
From the ADC screen, click the ADC - Final Settings arrow to review the settings. If you want to change any of the settings, follow these steps.
Click the appropriate selection from the ADC screen.
Click Compute to generate updated maps.
To apply a gray scale to a color map, execute the following steps:
Click the color ramp located on the left side of the viewport you want to change.
From the Color panel, click the color map menu arrow and select Linear Gray.
Close the Color panel (click X) to restore the DWI settings panel.
Optional: select any of the review steps, for example, a step with Mirror ROI.


 ).
).
 ).
).