Use these steps to generate parametric images from a time-course data set. The generated maps that are based on Artery Input Functions and Vein Output Functions. There are three modes to detect Artery pixels.
Auto Vessel Selection: Arteries are automatically detected and displayed (default option).
Semi Auto Vessel Selection: You place an ROI in the region of interest for the detection of arteries and veins.
Manual Vessel Selection: You define one artery and one vein.
When BrainStat AIF launches, the source, image maps and a time/intensity curve display. The image/graph displayed in each viewport is based on the selected protocol.
If the multiple vessel annotation is overlapped, click and drag each annotation to a new location.
Locate images that display the automatic vessel detection.
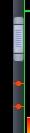
Click and drag the scroll bar on the active viewport. Note that the vessel locations are indicated by dots on the scroll bar. Figure 1. Red dots indicate the slice location of automatic vessel detection
Adjust W/L and magnification factor. Place the cursor in the desired viewport. Note that BrainStat initially applies best-estimate window width and level values for the Blood Flow and Blood Volume maps.