

- 00000018WIA3004B970GYZ
- id_400234381.2
- Mar 10, 2022 3:14:23 PM
View a summary table
About this task
Use these steps to view a table of the ROI statistics and mirror and distance measurements.
The summary table automatically captures measurements as they are made during a Volume Viewer session. Statistics can be compared over time to a reference date, which can be modified and display the percentage of change on comparison measurements.
Step-by-step instructions
- From the Export Toolbar, click the
 to view the Summary Table screen.
Figure 1. Summary Table screen with title bar visible 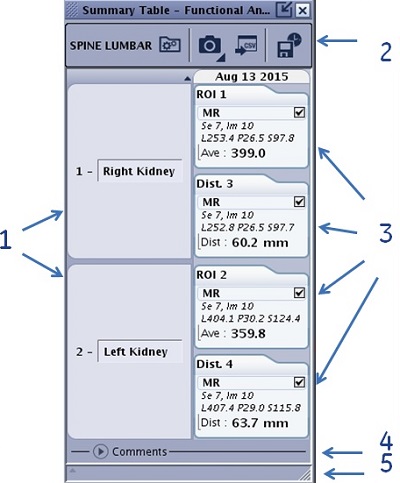
Table 1. Image legend Number Description/procedure 1 A group of measurements. The text field is editable. Place the cursor in the text field, highlight the content and type over with new content. 2 Title bar that is only visible if the Summary Table screen is undocked. 3 Index cards that have information about the ROI or measurement. - The number of the index card correlates to the measurement annotation on the image.
- The content in the measurement index card varies based on the series.
- Click on MR and the cursor associated with the measurement becomes active on the image. If the volume on which the measurement was acquired, is not displayed in any viewport, an error message is displayed in the Message history area.
- The check box allows you to unflag measurements for screen capture.
4 Comments area allows space for writing comments about the MR case. 5 Message history area. - For each compatible measurement performed on a viewport (arrow, report cursor, 2D ROI, 3D ROI, distance, angle, Auto Contour), the Summary Table displays:
- The volume on which it was performed.
- The measurement name/label.
- The statistics computed on the measurement (selectable).
- To move the Summary Table screen follow these steps.
- Click the
 located in the upper right corner of the Summary Table.
 - Click and drag the Summary Table to the desired location.
- Click and drag the title bar to expand it and view additional icons.
Figure 2. Summary Table title bar icons 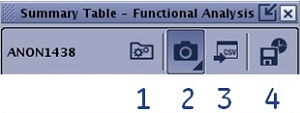
Table 2. Image legend Number Description 1 Options icon 2 Screen capture icon 3 Export on USB icon 4 Save state icon
- Click the
- To sort the items in the Summary Table, follow these steps.
- From the Summary Table title bar, click the
 .
. - From the options menu, click Sort findings by.
- Select Sort by Id to sort the index cards in numerical order.
- Select Sort by location to sort the index cards by anatomical location.
- Select a sort order: Ascending or Descending.
- From the Summary Table title bar, click the
- To select an option that determines if the measurements appear on a screen save, follow these steps.
- From the Summary Table title bar, click the arrow
 > Measures only option. to display the check box on the index card.
 - From the Summary Table title bar, click the .
- Flag all measures means that the measurements display on a screen capture.
- Unflag all measures means that the measurements do not display on a screen capture.
- From the Summary Table title bar, click the arrow
- To select options to save with the Summary Table, follow these steps.
- From the Summary Table title bar, click the .
- From the options menus, click Display options.
- Select all the desired options to display on the index card.
- Show/hide slice index which is the series number and slice location.
- Show/hide RAS coordinates
- Show/hide difference percent for relative comparison
- Show/hide absolute comparison (multiple dates only)
- Show/hide specific dates when multiple dates are displayed in Summary Table columns.
- Volumes summary: Show/hide specific modality when measurements have been performed on multiple modalities (e.g. show only measurements performed on MR series)
- From the Summary Table title bar, click the
- To create a screen capture and save the image as a SSAVE series, follow these steps.
- From the Summary Table title bar, click the .
- Select all the desired options.
- Summary Table only is a screen capture of only the table and not the measurements.
- Measure only means that only the measurements tagged as flagged are captured.
- Summary Table and measures results in a mini-report that has the numeric measurement values and the associated image with the plane, FOV, and W/L that were set when the ROI was deposited.
- To database saves the Measurements and Summary table to the exam. This button is defaulted on and can not be turned off .
- From the Summary Table title bar, click the
- To create a Save State of the Summary Table, follow these steps.
- From the Summary Table title bar, click the
 .
. - From the Save State panel, enter a series name and click Save.
- From the Summary Table title bar, click the
- To save the Summary Table to a USB device, follow these steps.
- Insert a USB device into one of the MR computer USB ports.
- From the Summary Table title bar, click the
 .
. - From the export Summary table screen:
- Navigate to the desired location on your USB device.
- Enter a file name.
- Click Export.
- Wait for the "Report generation successful" message to appear in the Summary Table message history area.
Figure 3. Export Summary table to CSV file on USB key screen 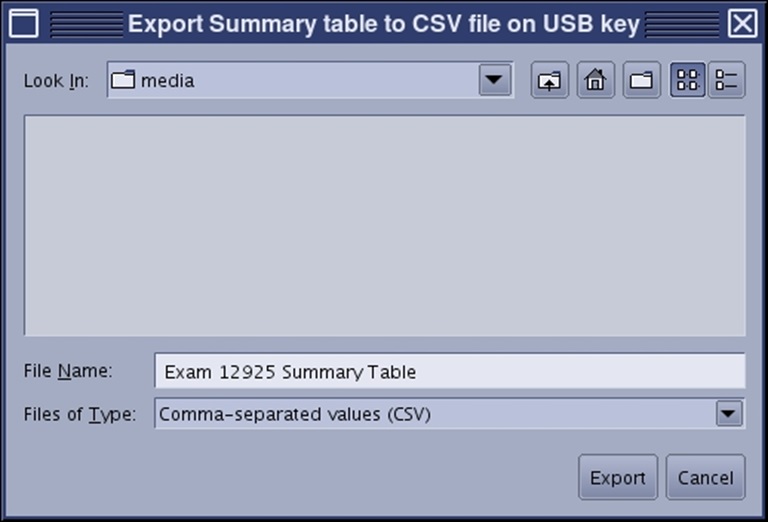
- The CSV file can be opened as an Excel file on a personal computer.
- To modify or delete a measurement from the Summary Table, follow these steps.
- Place the cursor over the measurement you want to modify and right-click to view the menu.
Figure 4. Summary Table right-click menu for distance measurement 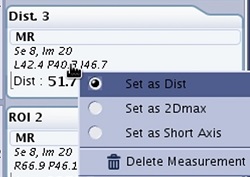
Figure 5. Summary Table right-click menu for ROI measurement 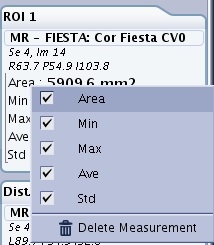
- Select an the statistics you want to display on the distance index card from the right-click menu.
- Set as Dist means to set the measurement annotation to distance.
- Set as 2Dmax means to set measurement annotation to 2D max.
- Set as Short Axis means to set measurement annotation to Short Axis.
- Select an the statistics you want to display on the ROI index card from the right-click menu.
- Area displays the ROI area.
- Min displays the minimum value within the ROI.
- Max displays the maximum value within the ROI.
- Ave displays the average ROI value.
- Std displays the ROI standard deviation value.
- Select Delete Measurement to remove the measurement from the table.
- Place the cursor over the measurement you want to modify and right-click to view the menu.