

- 00000018WIA30BEE770GYZ
- id_400246411.2
- Mar 9, 2022 10:39:21 AM
MR General Review work area
Open MR General Review, 3D Viewer, Reformat or READY View to display the Volume Viewer work area.
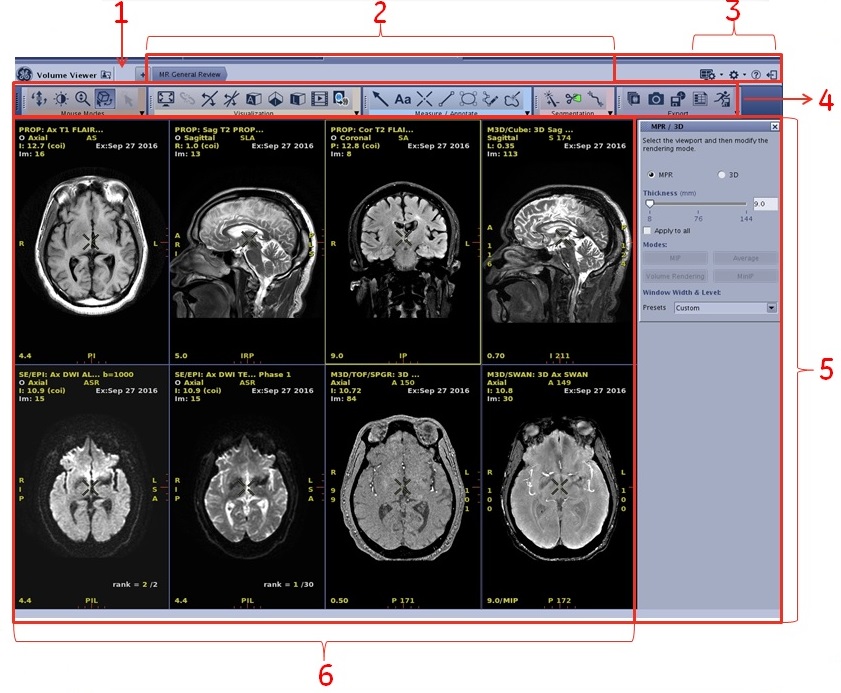
| Number | Description |
|---|---|
| 1 | Mini Patient list |
| 2 | List of review steps |
| 3 | Top level toolbar icons, for details, see Top level toolbar considerations/procedures |
| 4 | Toolbar icons, for details, see Toolbar introduction |
| 5 | Application panels |
| 6 | Source image/ image maps/graph viewports |
Mini Patient List
Click the ![]() to open the list of series for the currently active exam. The series already present in the session are shown in italics. To add series not present in the session, select a series from the list and drag and drop it into any viewport.
to open the list of series for the currently active exam. The series already present in the session are shown in italics. To add series not present in the session, select a series from the list and drag and drop it into any viewport.
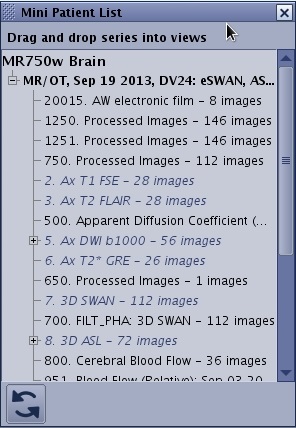
Click the  on the Mini Patient List screen to close the Mini Patient List and return to the current review session.
Review steps area
Review steps are displayed at the top of the MR General Review screen: the displayed review steps correspond to the series that exist in the current exam and were selected from the Series Loading Page.
For more Protocol details see Protocol selection work area.
The ![]() opens/closes the Protocol List screen from which you can select another review step. Protocol list is the list of all the protocols and review steps compatible with your data set. The list is filtered based on the selections made from the Protocol Filters menus.
opens/closes the Protocol List screen from which you can select another review step. Protocol list is the list of all the protocols and review steps compatible with your data set. The list is filtered based on the selections made from the Protocol Filters menus.
Click My Protocols to only display protocols you have chosen as favorites.
Type any key words in the Search field to easily find protocols within the protocol list.
The protocol list is ranked alphabetically with first the favorite protocols and in a second part, all the other protocols.
Click Protocol Page to open the Application Selection screen. If a new protocol is chosen within the protocol page, the loaded / selected series is launched into a new session and the previous session is lost.
Global icons
These icons are always available. For details, see Top level toolbar considerations/procedures.
Toolbar icons
This panel may be placed either on the user interface at the top of the screen (horizontal display) or at the side of the screen (vertical display), for details, see Toolbar move procedure.
Each tool panel has an arrow in the lower right corner. Click on the arrow to see other icons in that tool group. Click on an icon and many display a screen in the upper right corner of the user interface.
For details on all tools, see Toolbar introduction.
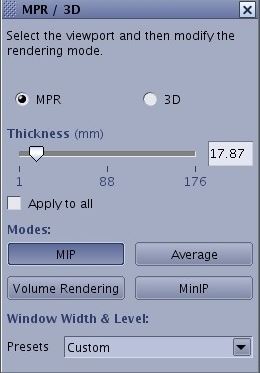
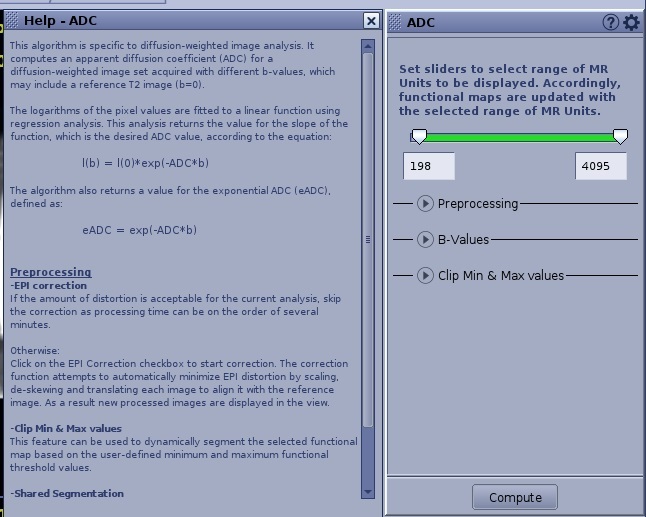
Application screens area
The content in this panel changes based on the currently active application and the selected review step.
- Screens that have a
 in front of the screen name can be picked up and moved to a new location on the screen.
 - The
 at the top of each panel displays additional selections. It is a toggle button that moves the screen area between two sets of screens.
 - The
 at the top of each panel opens toggles a screen on/off with explanations about the application screen.
Source image/ image maps/graph viewports
The content in the viewports changes based on the currently active application and selected review step. The viewport can display images, image maps, spectrum, graphs, etc. For details, see Select and view series/image/map procedures.