

- 00000018WIA30A2D770GYZ
- id_400258101.6
- Aug 16, 2022 6:38:59 PM
Graphic Rx
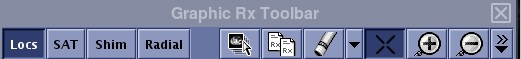
Graphic Rx is a toolbar that appears on a localizer viewport. The Graphic Rx Toolbar content changes based on the image type in the scan viewports.
Graphic Rx allows you to define slices and saturation bands while visualizing their exact locations on three different image planes simultaneously. It gives you the flexibility of manipulating slice location and placement on any one of the images interactively, while observing the resultant changes in the prescription in the other planes. Graphic Rx helps you achieve reductions in prescription time, as well as increase your prescription accuracy.
The Graphic Rx Toolbar content changes based on the image type in the scan viewports. For example, Tracker is not a selection unless a SmartPrep protocol is active. The Graphic Rx Toolbar can be moved anywhere on the screen.
Many of the Graphic Rx toolbar icons are toggle features, which means that you click it once to turn it on and click again to turn it off.
| Icon | Description |
|---|---|
 | Toggles the Graphic Rx toolbar on/off. |
 | Locs changes the function of the left-click from SAT to Graphic Rx. |
 | SAT allows you to place SAT bands on the image to eliminate signal from spatial or chemical locations. |
 | Shim allows you to place a Shim volume over the anatomy of interest to complete a special shim process that improves field homogeneity. |
 | IR applies Inversion Recovery SAT bands on the localizer. |
 | Radial allows multiple slices to be acquired around a central axis in the same series. |
 | Select Series allows you to select a series other than the 3-Plane localizer to display in the Graphic Rx viewports. You can also drag and drop images into the Graphic Rx viewports. |
 | Copy Rx allows you to copy the prescription lines from one series to another. |
 | Erase removes graphic or SAT prescriptions. |
 | Report Cursor displays the cursor location on each of the three viewports. |
 | Magnifying Glass zooms the active graphic viewport up (+) or down (-) in increments of a 0.5 factor. The default zoom factor is 1.0. |
 | Tracker defines the tracker slice location and thickness in a SmartPrep acquisition. |
 | Spectroscopy tool allows you to deposit Start and End slice locations for a spectroscopy sequence. |
 | More tools opens a menu for additional Graphic Rx tools. |