

- 00000018WIA30523970GYZ
- id_400233191.2
- Feb 13, 2022 1:35:12 PM
MAGiC DWI (Synthetic DWI)
MAGiC DWI (Synthetic DWI) may not be for sale in all markets due to approval or clearance by in-country regulatory agencies.
MAGiC (MAGnetic resonance image Compilation) DWI is the commercial name of the method to generate synthetically derived b-values on GE MR scanners, also referred to here as Synthetic DWI. MAGiC DWI uses DWI images that have been acquired conventionally with two or more b-values. These acquired DWI images are then processed to internally calculate DWI images with other b-values using the calculated Apparent Diffusion Coefficient. MAGiC DWI provides you with the ability to prescribe synthetic b-values when setting up a scan protocol or through post-processing after image acquisition is completed. MAGiC DWI prescribed via the scan protocol generates synthetically derived b-values in-line.
The intended use case of this feature is to obtain high b-value DWI when it is otherwise impractical to do so.
The key components of the MAGiC DWI application are as follows:
- DWI data acquisition
- Synthetic b-value User Interface
- Algorithm to generate MAGiC DWI images
- Post-Processing Application
Algorithm to generate MAGiC DWI images
In general, DWI image shows diffusion contrast depending on ADC and a given b-value. The ADC can be calculated using the acquired DWI with known b-values. The signal of the DWI image, SDWI, can be expressed as mono-exponential function shown in the equation below, where S0 is the signal at b-value = 0.
Equation 1
SDWI(b) = S0 • exp (-ADC•b)
By taking a natural logarithm, Equation 1 can be converted to the linear function as shown in the illustration below, where -ADC the natural logarithm of S0 can be regarded as the slope and Y-axis intercept, respectively. Once the ADC and Y-axis intercept were obtained, we can calculate the signal intensity of DWI with other given b-values by using Equation 1.
MAGiC DWI utilizes a linear least-square fitting in the logarithmic signal plot of DWI images and then calculates the MAGiC DWI image on the pixel-by-pixel basis. Illustration of logarithmic signal plot of DWI images figure below is an illustration of logarithmic signal plot of DWI images, where the dotted line is the linear function to be fitted.
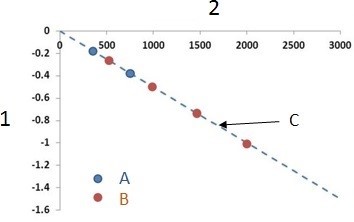
| Number | Description |
|---|---|
| 1 | Logarithmic plot of DWI signal |
| 2 | b-value |
| A | acquire |
| B | synthesize |
| C | slope = -ADC |
The calculation of ADC by using a linear least-square fitting in Illustration of logarithmic signal plot of DWI images figure is a well-known method and not newly introduced by MAGiC DWI. The same method to calculate ADC has been integrated on the currently available READY View and Functool application.