

- 00000018WIA30A13970GYZ
- id_400249321.3
- Aug 19, 2022 3:25:21 PM
EPI scan parameter selections
Use this information when changing an EPI scan parameter. For specific scan parameter values, select a protocol from your GE or Site library.
| CAUTION | |
|---|---|
| Parameter | Image effect | ||||
|---|---|---|---|---|---|
| Increase parameter | Echo space | SNR | Resolution | Scan time | Geometric distortion |
| Gradient Slew Rate | decrease | N/A | N/A | N/A | decrease |
| Receive Bandwidth | decrease | decrease | N/A | N/A | decrease |
| # of Shots | decrease | increase | N/A | increase | decrease |
| Frequency Matrix | increase | decrease | increase | N/A | increase |
| Phase Matrix | N/A | decrease | increase | N/A | N/A |
| FOV | decrease | increase | decrease | N/A | decrease |
| Phase FOV | N/A | increase | decrease | N/A | increase |
| Field Strength | N/A | increase | N/A | N/A | increase |
Image numbering
All T2 and diffusion images will be installed in a single series. For details, see Series numbering.
Contrast
EPI images can be acquired in the 2D mode combined with SE, GRE, IR, FLAIR, or DW imaging techniques.
| Pulse sequence | Resulting contrast |
|---|---|
| SE or GRE EPI | T2- or T2*-weighted |
| IR EPI | T1- and IR-weighted |
| FLAIR EPI | T2-weighted (minimizes CSF signal) |
| DW EPI | differentiates tissues with restricted diffusion from tissues with normal diffusion |
Scan timing
The Number of Shots is a scan parameter, which must be completed for an EPI scan. This is the number of TR periods used to complete the acquisition.
- Single-shot (snapshot) EPI acquires all data within one TR period.
- Multi-shot EPI acquires data within two or more RF excitation pulses.
EPI Scan Time = TR x Number of Shots x NEX
Spatial resolution
An EPI trade-off from using gradients versus RF to refocus the spins is that the EPI image becomes very sensitive to off-resonance artifacts (frequency difference between fat and water protons). After the initial RF excitation pulse, a spin that is precessing off-resonance gradually accumulates a phase error. This phase error builds over the course of the echo train and leads to a geometric distortion in the phase encoding direction. The longer it takes to sample the echo, the more time the water spins have to accumulate phase shifts and the greater the geometric distortion.
Geometric distortion can be reduced by:
- using the shortest possible echo spacing (keep the bandwidth as wide as possible, FOV as large as possible, and frequency matrix as small as possible).
- using multi-shot vs. single shot EPI to reduce geometric distortion - the higher the shots the less the distortion but the longer the scan time.
- using smaller values for frequency encoding to reduce ESP. Your protocol may have higher phase steps (512) than frequency (256) steps. Remember, EPI scan time is not affected by phase steps.
- using Ramp Sampling to reduce ESP, particularly when using high frequency matrix values.
All EPI pulse sequences are sensitive to field inhomogeneities (opposed to an FSE which virtually eliminates those effects). Therefore, pathologies that cause disruptions in the local magnetic field have a higher potential for contrast visualization in an EPI image.
SNR
EPI images typically use very large receive bandwidths so that the echo spacing can be as short as possible and thereby, reduce geometric distortion. The trade-off for a large RBw is an increased amount of noise and therefore lower SNR.
The loss of SNR can be gained by:
- increasing the NEX value
- changing scan parameters which affect resolution (matrix, slice thickness, FOV)
- As the RBw gets larger, the minimum FOV increases, which reduces the spatial resolution but gains the SNR that has been lost to the wide RBw.
- Consider decreasing the frequency matrix (enlarges pixel size for more SNR and decreases geometric distortion), while keeping the phase matrix unchanged; for example, a 256 phase matrix with a 128 frequency matrix.
Multi-phase, multi-repetition
EPI offers great flexibility when applications call for multiple passes and/or phases that need extremely short scan times and high temporal resolution. Possible EPI acquisitions include:
- single-pass, multi-slice, single-phase
- multi-pass, multi-slice, single-phase
- single-pass, multi-slice, multi-phase
- multi-pass, multi-slice, multi-phase
Pass: one trip through the slice or slices within a given TR period. For example, if 15 slices can be acquired within a TR of 2000 msecs (and 15 slices have been prescribed) then one pass covers the 15 slices in 2000 msec. Very often the term acquisition or acqs is used instead of pass.
Phase: used to describe a particular image that is part of a group of images at the same location. These phases could be cardiac phases or phases of contrast uptake or phases of task activation. Any sequence in which the same slice location is imaged more than once can be termed a multi-phase sequence. When more than one slice location is being acquired over more than one pass, meaning a multi-phase multi-pass exam, understanding the difference between pass (or rep) and phase then becomes rather important.
Acquisition types
Interleaved: all the slice locations go through a single phase for a single pass before moving to the next phase.
Sequential: all the phases for one slice location are collected before moving on to the next location.
For motion studies, where a particular slice location needs to be viewed while moving, a sequential acquisition is often the choice to make. However, when viewing contrast uptake over time through multiple slice locations, a common application in EPI, then an interleaved acquisition is better suited.
k-space
K-space is the domain that contains the MR raw data, which after undergoing a inverse Fourier transformation, becomes the image. Several key points about k-space include:
- K-space must be at least 65% filled to produce an image.
- The manner in which k-space is filled (top to bottom, middle to edges) has an effect on the contrast.
- The position of information within k-space does not correlate to a spatial position within the image.
- The phase gradient’s amplitude determines the strength of the signal echoed back. Low phase gradient amplitudes produce strong echoes and fill the middle of k-space, while high phase gradient amplitudes produce weaker echoes with high spatial information and fill the edges of k-space.
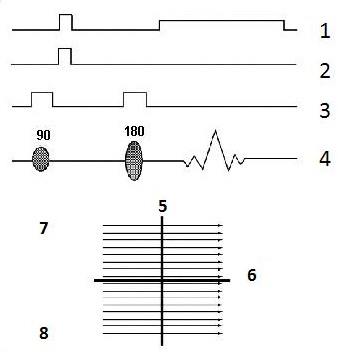
| Number | Description |
|---|---|
| 1 | Frequency |
| 2 | Phase |
| 3 | Slice |
| 4 | Signal |
| 5 | Ky (phase) |
| 6 | Kx (frequency) |
| 7 | Begin 1 |
| 8 | Begin 128 |
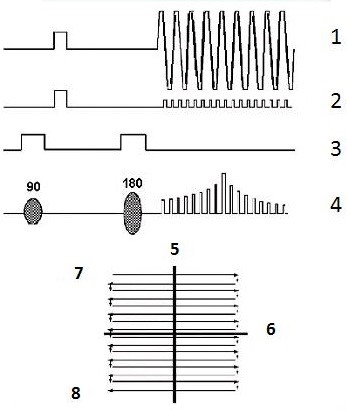
| Number | Description |
|---|---|
| 1 | Frequency |
| 2 | Phase |
| 3 | Slice |
| 4 | Signal |
| 5 | Ky (phase) |
| 6 | Kx (frequency) |
| 7 | Begin |
| 8 | End |