To change fMRI settings, make a selection from the desired fMRI screens.
Step-by-step instructions
From the fMRI screen, click and drag the left threshold slider until the brain is outlined in green and all the anatomy inside the image displays green lines.
Note: Compute does not update the threshold. As the upper or lower slider is moved or a value entered in the text box, the threshold automatically updates.
From the fMRI screen, click the Reference Pattern arrow to set the paradigm pattern.
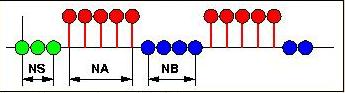
Figure 1. Example of a paradigm pattern with 5 on 4 off states
It is imperative that the numbers you enter accurately reflect the paradigm used during acquisition. Incorrect numbers result in wrong or no parametric maps.
The algorithm used by this protocol computes the correlation between the temporal variations in time course data and a reference pattern that represents the periodic activation during the acquisition. The reference pattern can be different from exam to exam. The pattern consists of the alternation of a series of NA images corresponding to an active state (illustrated by red bullets in the panel), and NB images corresponding to an inactive state (illustrated by blue bullets). The beginning of the pattern may contain a number NS of images to skip (illustrated by green bullets).
During the acquisition, the ”active” state of the reference (activation) pattern can induce either a positive or a negative change of the signal, depending on the type of periodic stimuli used and the resulting physiological processes. As a result, the correlation coefficient and activation magnitude at a given pixel location can also be either positive or negative. For clarity, positive and negative correlation coefficient and activation magnitude are displayed in separate functional maps. The protocol generates functional maps for the following quantities:
Positive Activation Magnitude
Positive Correlation Coefficient
Negative Activation Magnitude
Negative Correlation Coefficient
These maps are accessible from the functional map viewport. Click the active annotation at the top of the image, that currently shows Positive Activation Magnitude or any of the other three functional map options, and choose any of the proposed options.
If you change a parameter, click Compute to generate maps with the new settings.
Ensure that the activation and rest durations are set correctly before computing functional maps in the Functional protocol.
In the NS text box, type the number of images you want to skip that are part of your data set. For example, if your exam uses a 10 sec on/off paradigm, and you start with a task off state, typically enter 10 for NS.
In the NA text box, type the number of images representing the active state of your paradigm, typically 10.
In the NB text box, type the number of images representing the inactive state of your paradigm, typically 10.
Click Compute to generate the maps.
If the colored map does not show activation in the expected areas, or if colored plots show up at the periphery of the brain or even outside, then it means that the patient was not executing the paradigm properly, or the head was moving during the acquisition, or that there might be a discrepancy between the paradigm used during the acquisition and the one used for processing.
A graph is automatically displayed and the activation map is displayed in the upper right viewport. A very noisy curve can represent inaccurate paradigm performance by the patient (the on task is moving into the off task time frame). A spiky graph can mean that either your protocol needs to be adjusted or that your threshold needs adjustment (e.g. you could be picking up a vein). Do not place the ROI over anything pulsatile. The red plot on the graph represents the on/off pattern of your paradigm and the green plot is the blood flow.
From the fMRI screen title bar, click the .
From the fMRI screen, click the FMRI - Advanced Settings arrow to change the Confidence Level or Kernel Spatial Smoothing.
The Kernel spatial smoothing default value is 0.
The algorithm uses regression analysis to compute the correlation between image data and reference pattern. The confidence level indicates how well the final result fits the data: a small value corresponds to high confidence and a large value corresponds to low confidence. The user can set a confidence level threshold: pixel locations for which the algorithm returns a confidence level above the threshold are displayed in black on the functional map. By default, the protocol uses a confidence level of 0.1% (0.001).
As the kernel size increases, voxel averaging occurs and the image maps appear smoother.
If the confidence level is too low, it can result in points plotted both inside and outside the image. The points outside the skull represent noise. Increasing the confidence level from 0.01 to 0.001 can make the noise points outside the brain disappear.
Change the desired settings.
Click Compute to generate updated maps.
Reset changes the selections to the factory default values.
Save All changes and saves your selections as the new default values.
From the fMRI screen, click the FMRI - Final Settings arrow to review the settings. If you want to change any of the settings, follow these steps.
Click the appropriate selection from the fMRI screen.
Click Compute to generate updated maps.
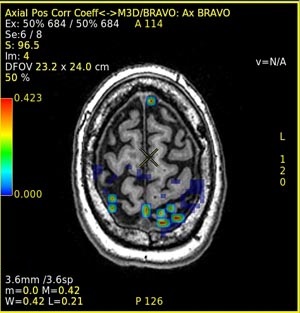
Fuse the source image with a map. For details, see Fuse images/maps.
Figure 2. Example of activation map fused to anatomical image


 .
.
 .
.