

- 00000018WIA30688970GYZ
- id_400254941.2
- Mar 15, 2022 5:32:26 PM
T2 Map
The READY View T2 Map protocol post processes data sets acquired using the T2 Map (Cartigram) application. The T2 Map acquisition is displayed in READY View, where the T2 relaxation time color map is coded to capture T2 values from the TE range of the acquired images.
Algorithms
The signal obtained from T2 decay is described by the following relation:
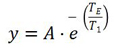
where:
y = Signal Intensity
A = Constant
TE = Echo Time (from acquisition)
T2 = T2 Relaxation Time
Taking the logarithm on both sides converts this into a linear equation:
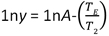
which is of the standard form:
y = mx + c
where:
m => T2-1
c => ln(A)
The T2 Map algorithm performs a least-squares linear fit of the log-transformed signal intensity data plotted against TE. The fit is performed after first discarding trailing echoes whose intensities fall below the user-defined noise threshold.
Success of the fitting algorithm is governed by comparison of the resultant chi-squared value with a reference threshold derived from the user-specified confidence level.
Constraints:
The T2 Map algorithm is designed to work best with 8 or more echoes. Acquisitions with less than 4 echoes cannot be processed.
T2 Map measurement units
The T2 Map functional maps have the following units of measurement.
| Maps | Units |
|---|---|
| T2 Map | ms |
READY View protocols that use T2 Map scan data
- T2 Map
- MR Knee