- 00000018WIA30D15880GYZ
- id_20349101.6
- May 19, 2022 11:19:34 AM
Breast: manual prescan for silicon impants
Silicone implant imaging requires high-resolution images.
Before you begin
Keep the following in mind when you select a suppression technique.
| Suppression technique | Center frequency placement | Frequency shift |
|---|---|---|
| Fat SAT | Water peak | -220 Hz |
| Water SAT | Fat peak | +220 Hz |
| Silicone suppression: select a protocol with Water SAT | Fat peak | -100 Hz |
| Silicone suppression: select a protocol with Fat SAT | Water peak | -320 Hz |
About this task
The type of contrast required is dependent on the clinical needs.
- Fat suppression
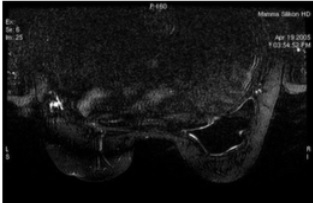
- Silicone suppression for evaluating fat or other tumors
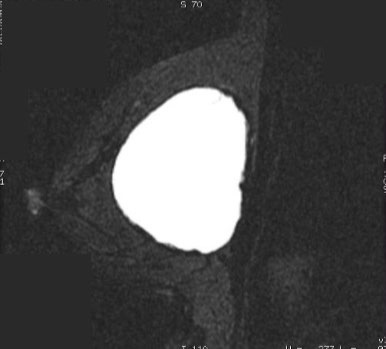
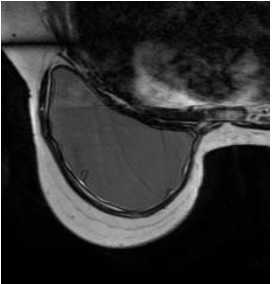
- Bright silicone contrast for evaluating prosthesis dislocation, intracapsular or extracapsular ruptures, or capsular contractures
| Silicone contrast | PSD and SAT | Tissue contrast |
|---|---|---|
| Bright | Silicone bright with water SAT:
|
 |
| Bright | Bright silicone with Fat SAT:
|
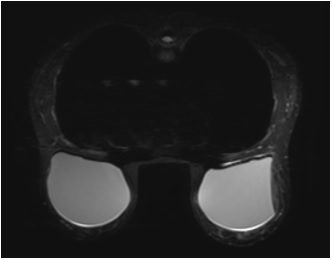 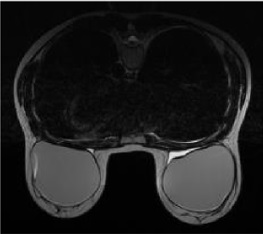 |
| Dark | Dark silicone with fat SAT
|
 |
| Dark | Dark silicone with STIR
|
 |
| Bright | Dynamic (with and without contrast) or multiphase with Fat SAT or Flex
|
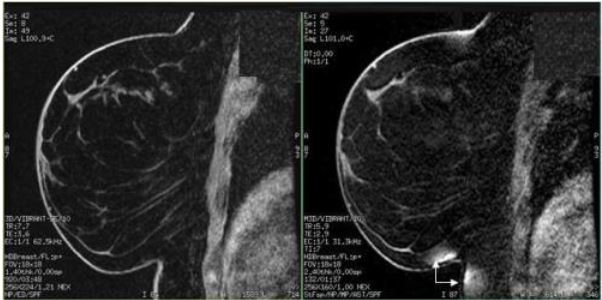 |
Silicone implant imaging can be very difficult because with silicone there are three peaks in the manual prescan spectrum, and this can confuse the system during auto prescan because the silicone peak is often the strongest (tallest) peak. Therefore, with most sequences with silicone, you must do manual prescan to make sure prescan is centered on the correct peak to saturate fat, water, or silicone.Figure 7. Spectra illustrating relationship of water, fat, and silicon peaks 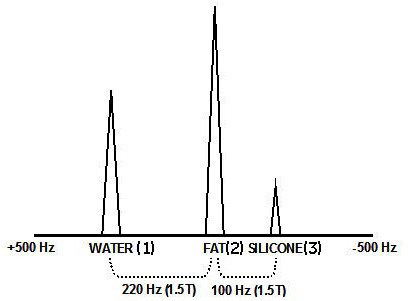
| Number | Description |
|---|---|
| 1 | Water |
| 2 | Fat |
| 3 | Silicone |
Step-by-step instructions
- From the Chem SAT menu, select the appropriate SAT pulse.
Figure 8. Chemical SAT menu 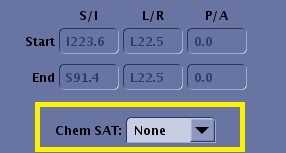
- From the scan menu, select Auto Prescan.
Figure 9. Scan menu 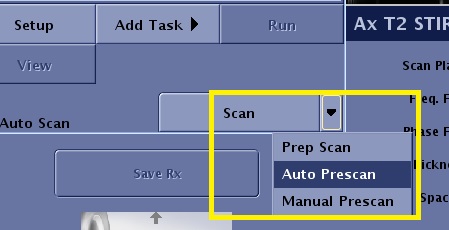
- Auto Prescan is performed and it automatically optimizes the transmit gain and receive values for the area of interest.
- From the manual prescan screen, click Center Frequency Fine to view the peaks.
- Slide the Rec bar to the right until it is on the highest receiver.
Figure 10. Center frequency prescan screen 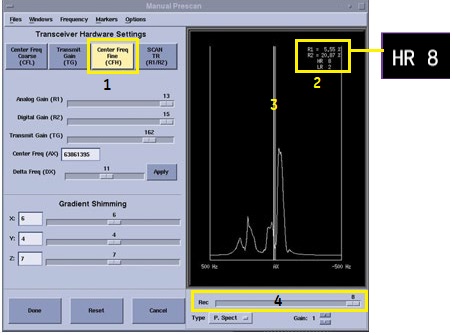
Number Description 1 Center Frequency Fine 2 Coil receiver value 3 The line in the middle represents AX (actual frequency or where the CF is centered). 4 Rec slider allows you to select a coil receiver.
- Adjust the center frequency over the appropriate peak, which peak depends on the desired type of suppression. There are two methods in which you can adjust the peaks.
- Method 1
- Click Center Frequency Coarse (CFL).
- From the manual prescan menu bar, select . A thicker vertical line appears next to the center frequency line.
- Left click and drag the vertical hairline over the peak you want to suppress.
- Click the middle mouse button to apply your selection. This may take a few seconds. Repeat this step if needed to suppress the signal as much as possible.
- Once you are satisfied with the center frequency, click Done.
- From the scan control area, click Scan.
Figure 11. Method 1 for center frequency adjusment 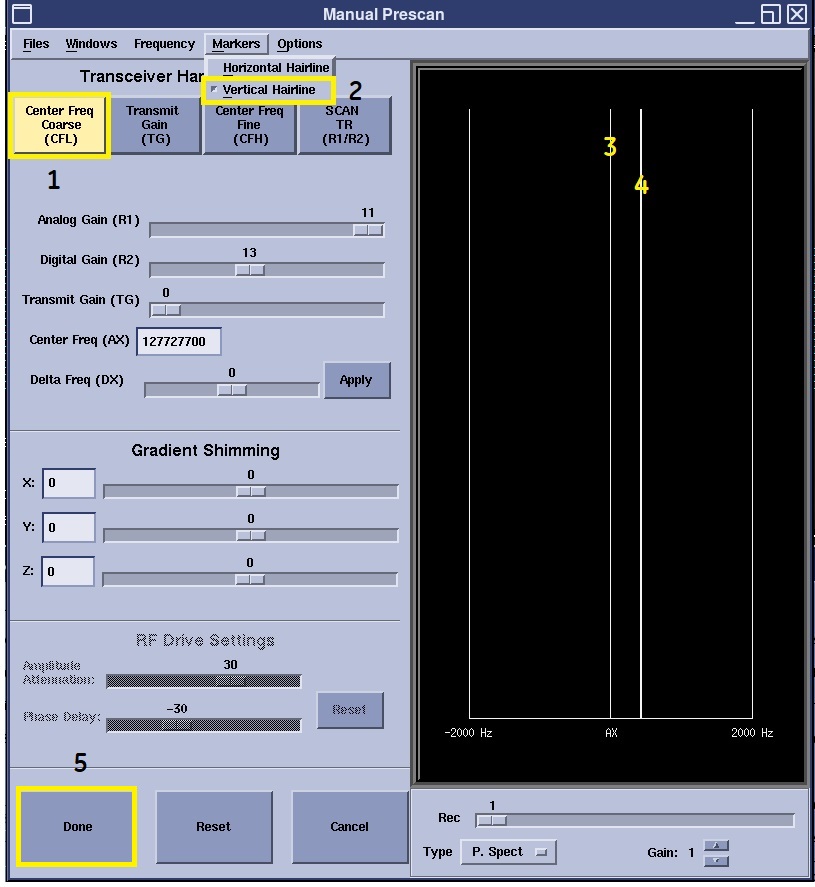
Number Description 1 Center Frequency Coarse 2 Vertical Hairline marker selection 3 Center frequency line 4 Vertical Hairline marker 5 Done button accepts changes to the manual prescan screen and closes the screen. - Method 2
- Click Center Freq Fine (CFH).
- Move the Delta Freq (Dx) slider bar the appropriate number of Hz you want the spectrum to move.
- Click Apply to move the delta frequency. This may take a few seconds.
- Repeat the adjustment of the delta frequency and Apply steps until you are centered on the desired peak.
- Sometimes the water and fat peaks are not clearly dilineated, particularly when silicone is present. You can still center on the desired peak by centering on the silicone peak, then change the CF offset by moving the Delta Frequency slider to the left, the direction that water and fat sit in relation to silicone.
1.5T example: To center on water on if the peak is on silicone, move the slider 320 Hz to the left. The maximum the slider moves per action is 200 Hz. Therefore, to move 320 Hz, first move 200 and click Apply, and then move120 and click Apply again)
- Once you are satisfied with the center frequency, click Done.
- From the scan control area, click Scan.
Figure 12. Method 2 for center frequency adjustment 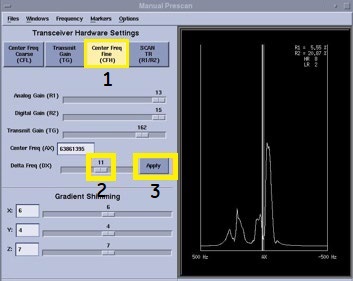
Number Description 1 Center Frequency Fine 2 Delta Freq (Dx) Delta frequency slider 3 Apply button applies the frequency set by the Delta Freq (Dx) slider - Method 1
- To suppress silicone, change the center of the water or fat pulse.
- Select a protocol that has Fat selected from the Chem SAT menu.
- From manual prescan, place the center frequency over the water peak.
Figure 13. 1 = water peak, 2 = fat peak, 3 = silicone peak 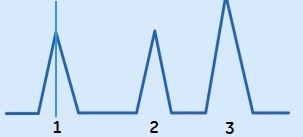
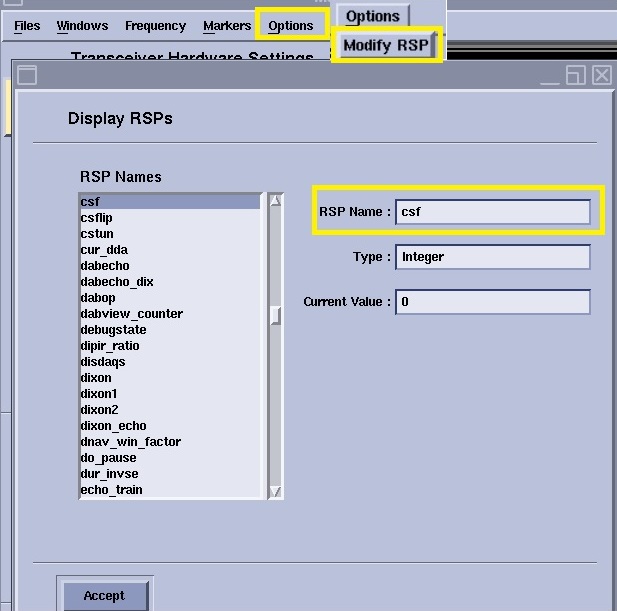
- From the manual prescan menu bar, click Options.
- From the Options menu, select Modify RSP.
- In the RSP text field, type csf.
- Change the value in the Current value text field to make the appropriate frequency shift to suppress silicone.
Figure 14. 1 = water peak, 2 = fat peak, 3 = silicon peak 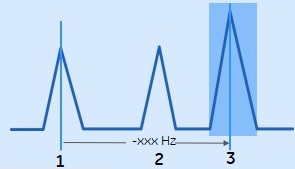
- From the Display RSPs screen, click Accept.
- From the Manual Prescan screen, click Done.
- From the scan control area, click Scan and enter -320.
Figure 15. Silicon suppression Display RSPs