

- 00000018WIA30568970GYZ
- id_400255761.2
- Mar 10, 2022 5:49:55 PM
Create a merged Volume Rendered view workflow
About this task
Use these steps to merge many data types to create a new view of the anatomy. In this example, a DTI data set FiberTrak view is merged with the 3D data sets and the pathology of interest.
Step-by-step instructions
- From the Session Appls list, click MR General Review.
Figure 1. Example of an exam with multiple series 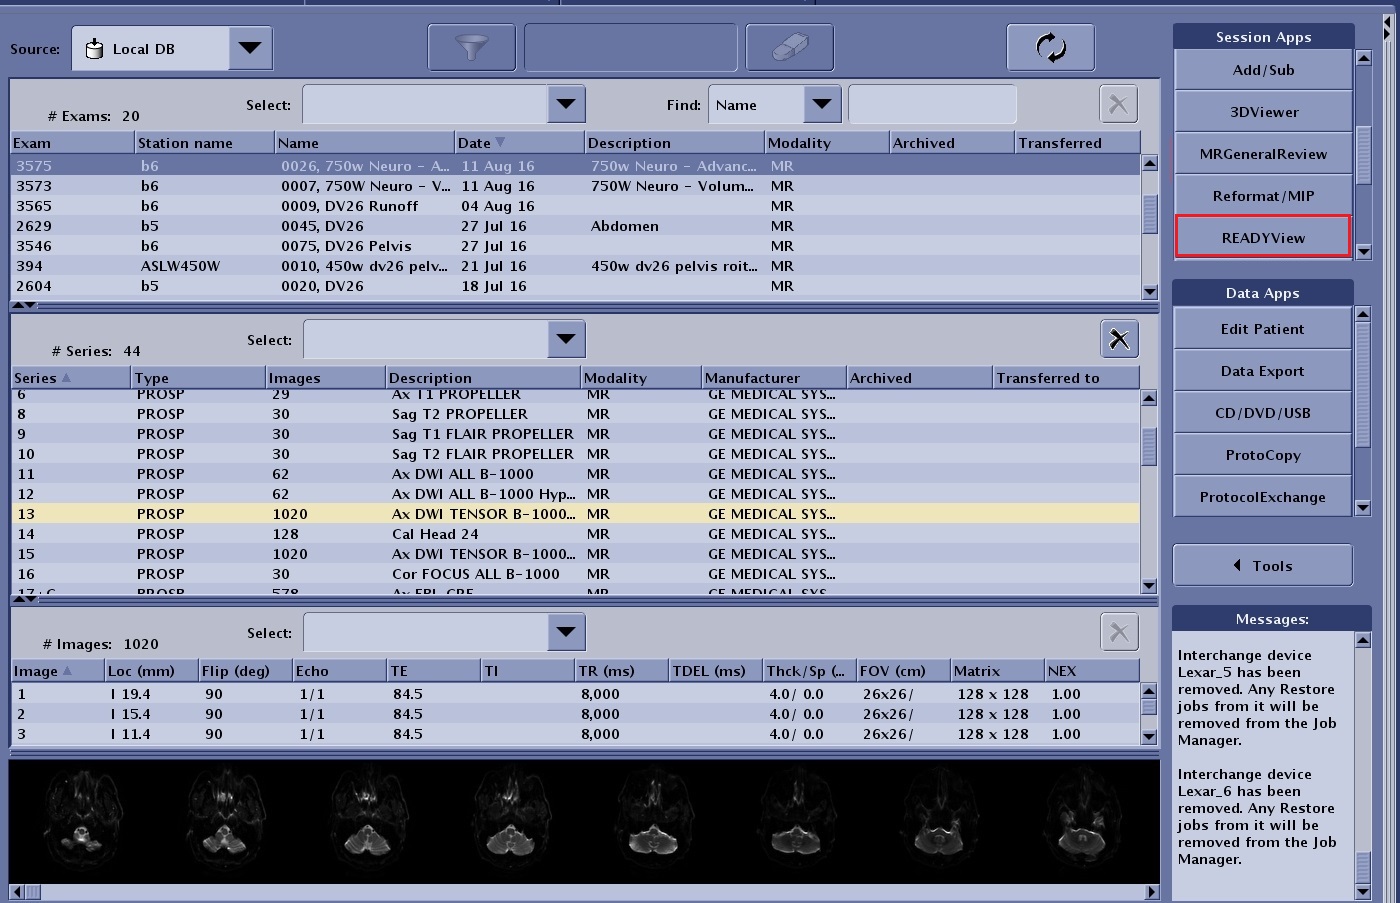
- From the Loading panel, select the desired series and click OK.
- Based on the exam selected, the Protocol Selection screen may appear, which first requires the selection of a protocol. In this example, only a DTI series was in the exam and the protocol page was by-passed.
Figure 2. Loading panel 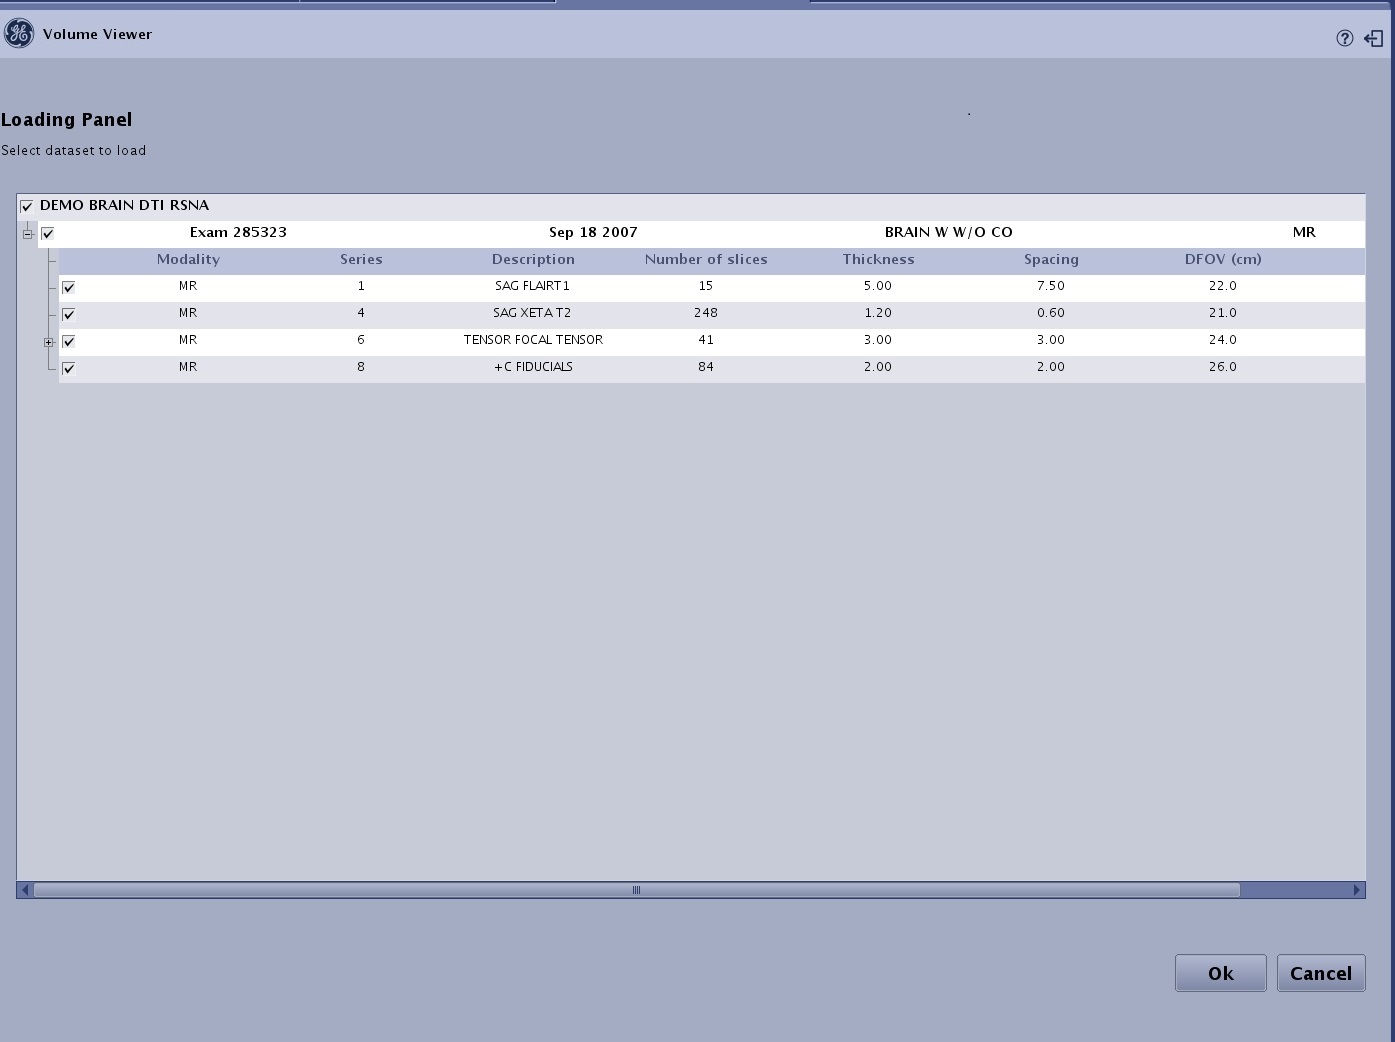
- The DTI protocol is launched. All selected series are displayed in the Review Steps. DTI, FiberTrak, Mirror ROI, Main EigenVector, Colored Orientation, ADC and T2-Weighted Trace are always displayed with the DTI protocol. Other series displayed in the Review Steps are dependent on the series selected from the Patient List.
- From the Review Steps, click FiberTrak.
- The coronal, sagittal and axial viewports are displayed as Colored orientation maps.
Figure 3. FiberTrak review step selected 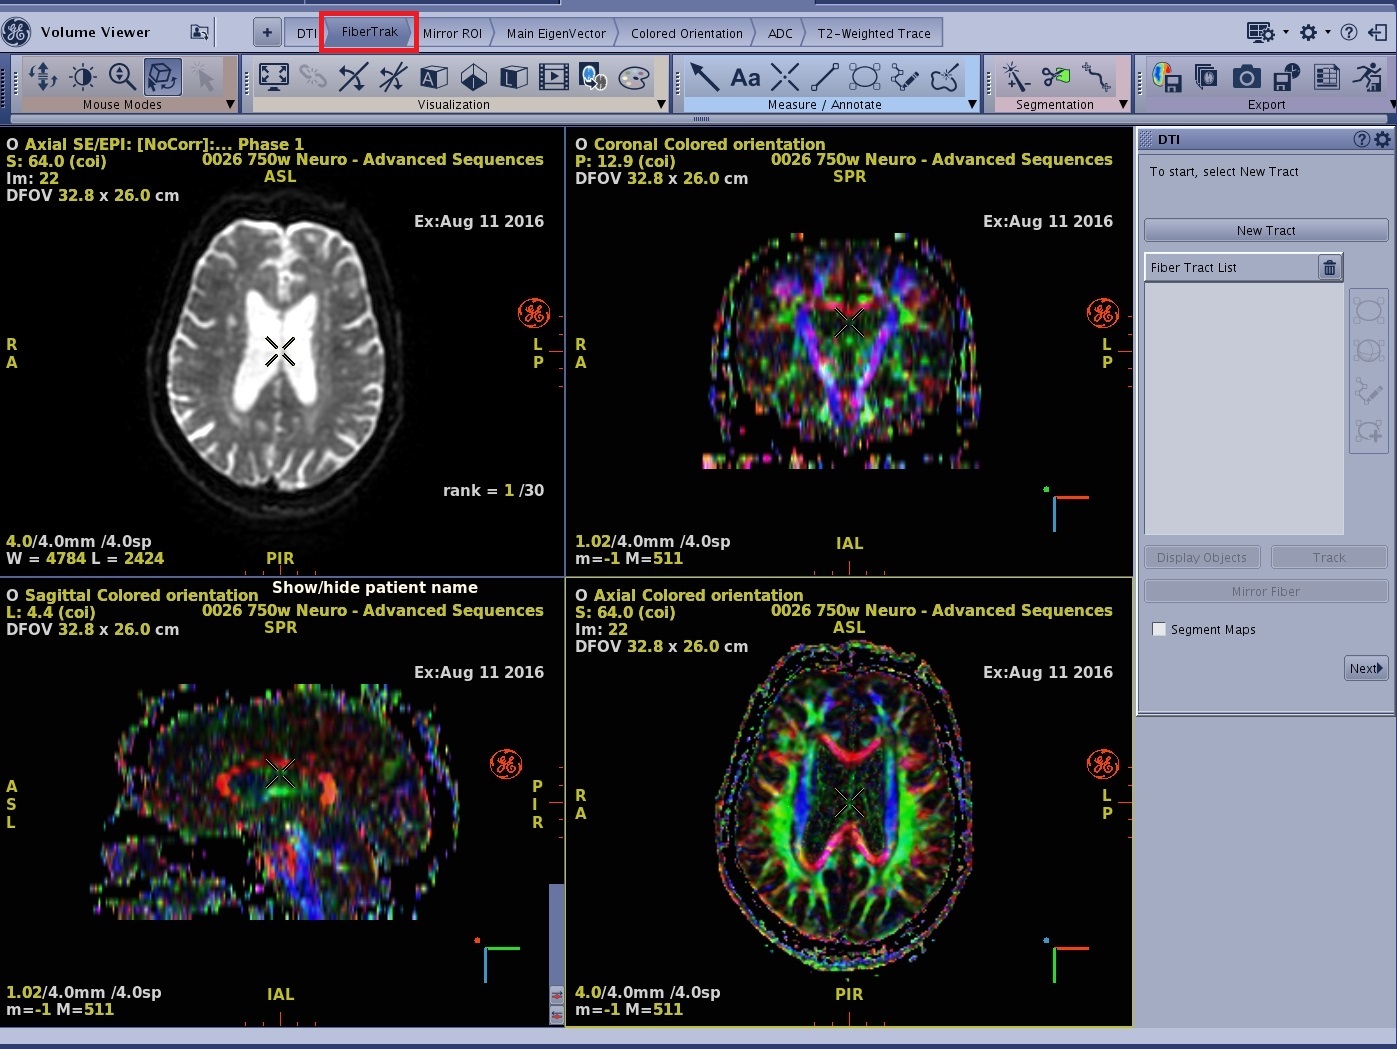
- The coronal, sagittal and axial viewports are displayed as Colored orientation maps.
- To create the DTI FiberTrak view, follow these steps.
- From the DTI FiberTrak screen, click New Tract.
- Click one of the ROI icons from the DTI FiberTrak screen.
- Position the cursor over the area of interest and click to deposit the ROI. Size and shape the ROI as needed.
- Click Track to generate updated tracking fibers.
- Each time you add a new tract, the system automatically assigns a tract color. To change the color of the tract:
- Click the color icon next to the trash can and a color palette appears.
- Click and drag the color cursor over the desired color.
- Click the X on the color palette window to close it.
- To apply color scheme to the fiber tracts, place the cursor in the fiber tract viewport and right-click on the yellow Default and then click User Color.
- Repeat these steps for the additional FiberTraks
Figure 4. Create FiberTrak 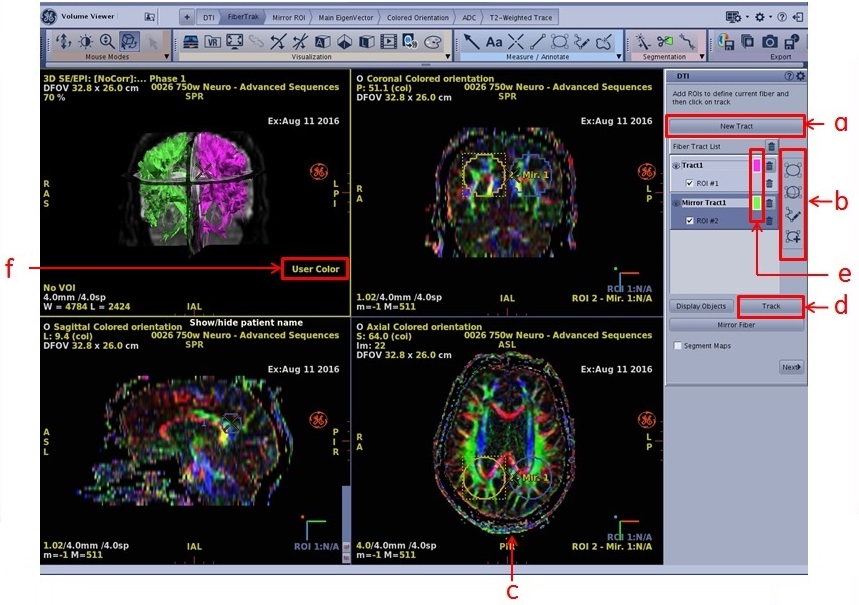
- To merge the 3D views with the FiberTraks, follow these steps.
- From the sagittal color orientation viewport, click on Color orientation and select the 3D view.
Figure 5. Color orientation 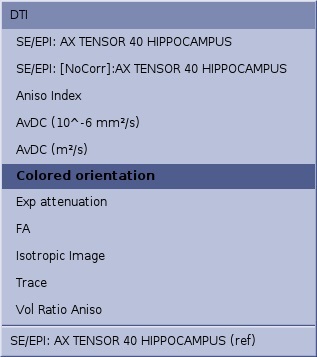
- From the plane selection menu, click Sagittal.
- Scroll through the images to locate an image that displays the pathology of interest.
- With the mouse in
 , click an image and drag it over the FiberTrak viewport and drop it in the "Drop here to merge the views" box.
- Respond to any prompts
- From the coronal orientation viewport, click Color orientation and select the 3D view.
- From the plane selection menu, click Coronal.
- Scroll through the images to locate an image that displays the pathology of interest
- With the mouse in , click an image and drag it over the FiberTrak viewport and drop it in the "Drop here to merge the views" box.
- Respond to any prompts
Figure 6. Merge views 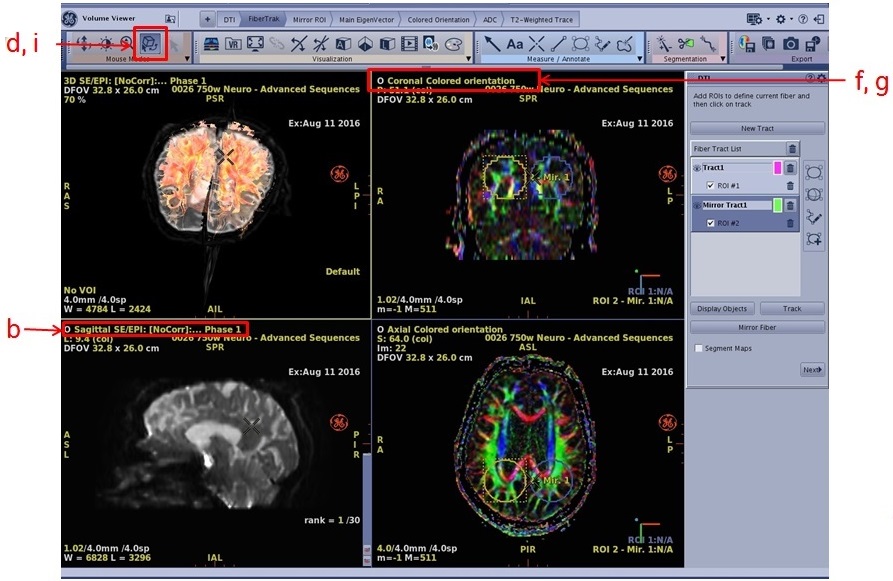
- Respond to any prompts
- From the sagittal color orientation viewport, click on Color orientation and select the 3D view.
- To merge the 4 views (FiberTrak, Sagittal, Coronal and Axial), follow these steps.
- From one of the 3D viewport plane selection menus, click Axial.
- Scroll through the images to locate an image that displays the pathology of interest
- With the mouse in , click an image and drag it over the FiberTrak viewport and drop it in the "Drop here to merge the views" box.
- Respond to any prompts
Figure 7. 4 views merged 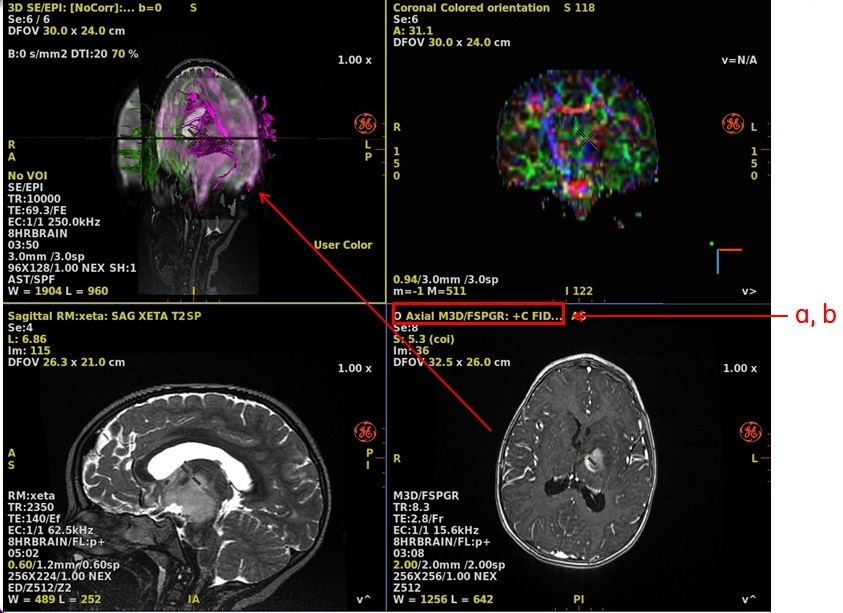
- Respond to any prompts
- To apply Auto Contour to the area of interest, follow these steps.
- From the Measure/Annotate Toolbar, click the
 , which opens the Auto Contour screen.
Figure 8. Auto contour 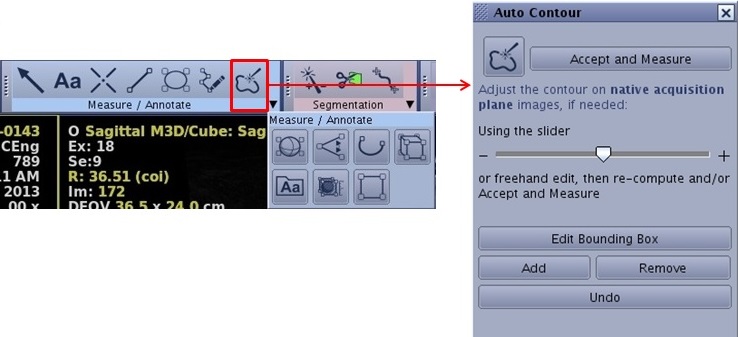
- From the 3D view, click in the center of the area of interest.
- From the Auto Contour, click Accept and Measure.
Figure 9. Auto contour area of interest 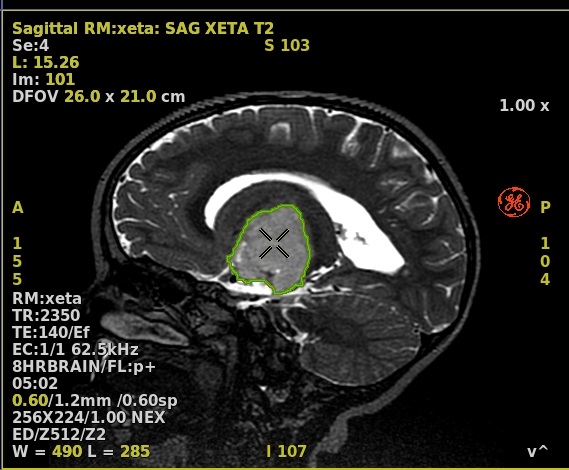
- From the Measure/Annotate Toolbar, click the
- To cut outside the Auto Contour, follow these steps.
- From the viewport that contains the contour, right-click and select Cut All Outside.
Figure 10. Right-click menu 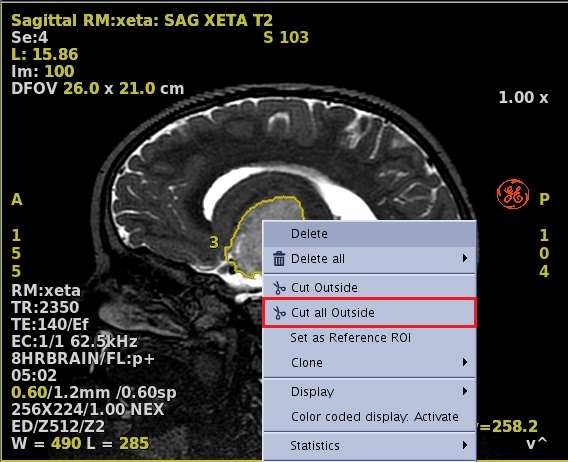
- The auto contour structure displays with all other data removed from the viewport.
Figure 11. Auto contour object 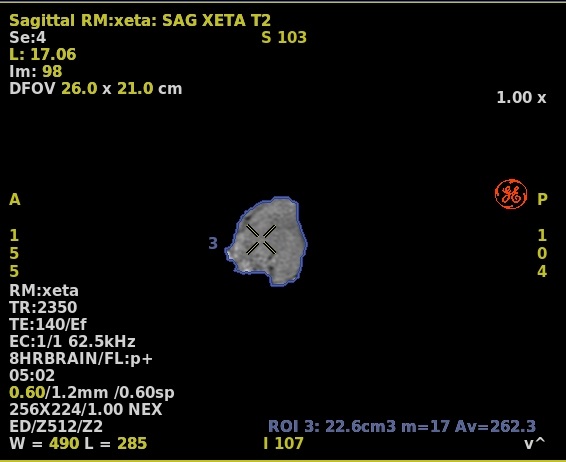
- From the viewport that contains the contour, right-click and select Cut All Outside.
- To change the Auto Contour to a VR image, right-click in the cut viewport and select VR.
Figure 12. Volume rendered image 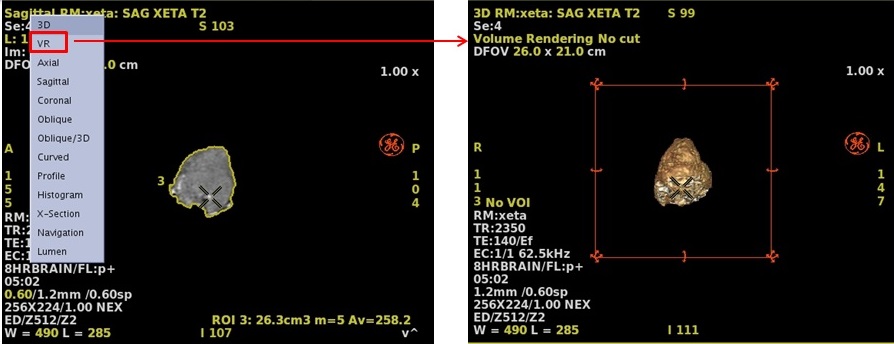
- To merge the VR view with the FiberTrak, follow these steps.
- Place the mouse in
- Click and drag the VR image to the FiberTrak viewport and drop it in the "Drop here to merge the views" box.
- Respond to any prompts
Figure 13. VR and Fibertrak merged 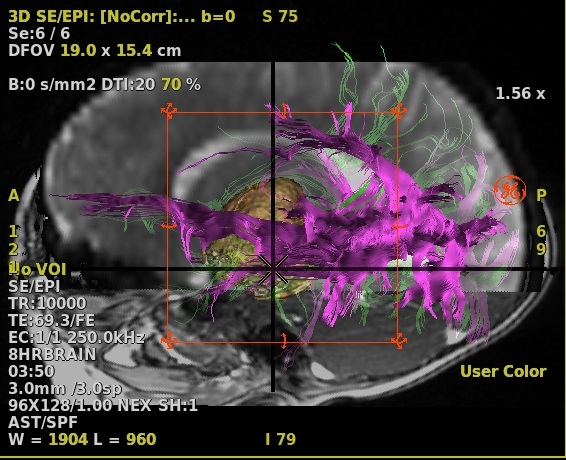
- Respond to any prompts
- Place the mouse in
- To show/hide desired objects on a merged viewport, follow these steps.
- From the DTI FiberTrak screen, click Display Objects.
- Display Object is a list of fiber track objects. An open eye displays the object on the fiber track viewport and a closed eye hides the object on the fiber track viewport. The objects can be the orthogonal planes, a volume rendered 3D head, a 2D anatomical image, individual fiber tracks, etc.
- From the Multi-objects screen, click the Hide/Show icon to
 or
or  the background structure.
Figure 14. Hide/show objects 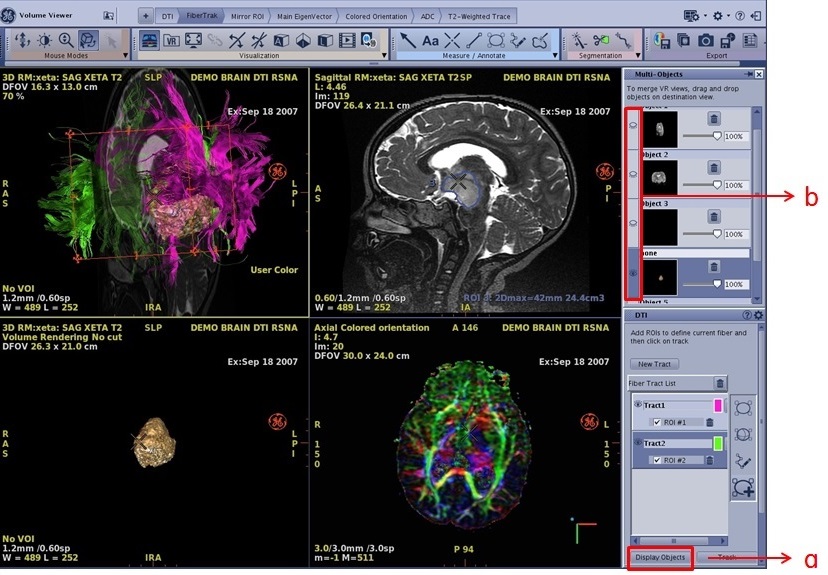
Figure 15. Example of Multi-Objects that are Shown and Hidden 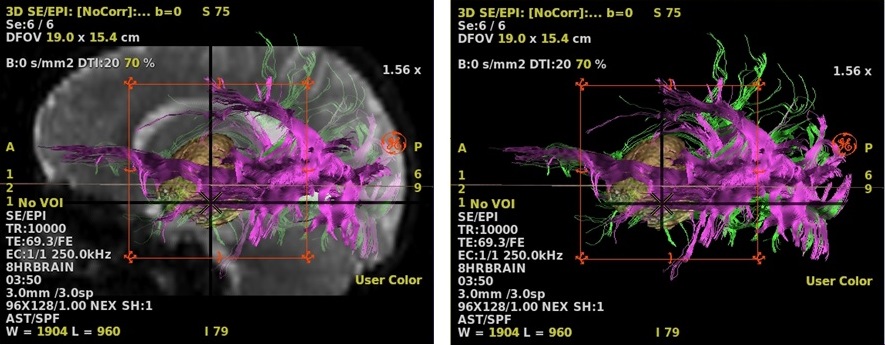
- From the DTI FiberTrak screen, click Display Objects.