Use these steps to graphically prescribe a single voxel spectroscopy scan.
Step-by-step instructions
Display the desired localizer images in Graphic Rx.
Place the cursor over the image that represents the scan plane in the protocol and click to deposit the VOI.
For example, if the protocol is for an axial scan plane, deposit the VOI on an axial localizer image.
The VOI should be placed in a magnetically homogenous region, i.e., away from the sinuses, or the base of the brain, or the scalp.
Optional: If you need to change the voxel thickness, change it from the Voxel Thickness text box and do NOT change the VOI depth on the Graphic Rx images.
If you deposited the VOI on an axial, then do not change the VOI size on the coronal or the sagittal.
You can change the VOI size on the axial because this is not changing the depth of the VOI.
Do not change the Center Z value.
Do not change the CSI Slice Thickness value. It does not mean anything. The Voxel Thickness value determines the depth of the VOI.
To visualize the spectroscopy VOI in the sagittal and coronal planes when you deposit the VOI on an axial image, click the sagittal or coronal viewport and scroll up and down until you see the VOI.
If you do not see the VOI on the sagittal or coronal plane it is because you did not acquire a sagittal or coronal localizer at the location of the VOI.
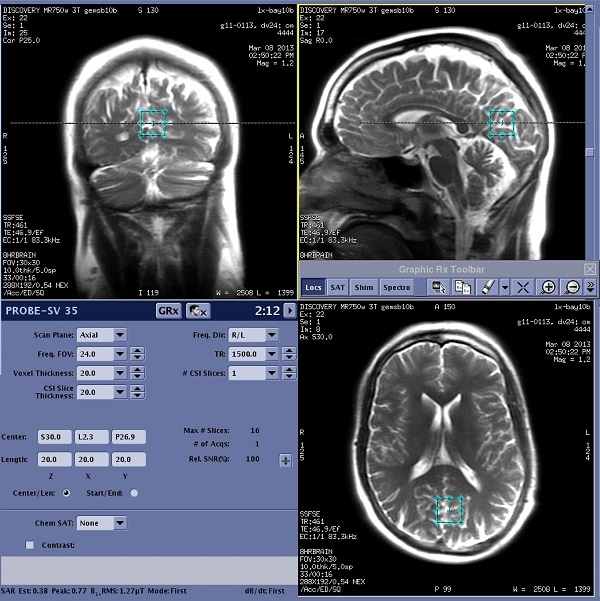
Prescription example Figure 1. Example of The spectroscopy VOI is cross-referenced in all three planes
Click the viewport that represents the protocol's scan plane and click Reset Center from the Graphic Rx Tool menu to reset the center of the third dimension of the voxel.
This insures that you have a localizer that represents the VOI location.
There are six VSSSAT bands automatically placed around the voxel when the ROI Edge Mask User CV is set to 7, which is the default. You may also place additional SAT pulses by clicking SAT on the Graphic Rx Toolbar and then select the desired direction(s).
The SAT bands can be placed to reduce the effects of magnetic inhomogeneity (for example air/tissue, lipid/water interfaces) near or around the voxel.
Do not use Shim Volume with spectroscopy prescriptions - it is not compatible.
Click SaveRx.
If required, press Move to Scan.
Click Scan > Auto Prescan to start the APS processes.
The APS processes optimize the transmit (TG) and receiver gains (R1 and R2), the center frequency, the shim (the Autoshim process), and, specific to the spectroscopy pulse sequences, the power of the water suppression pulses.