• Object ID: 00000018WIA30300970GYZ
  • Topic ID: id_40022245 Version: 1.6
  • Date: May 26, 2022 10:30:58 AM

PROBE 3D CSI: acquire a scan

About this task

In order to display the localizer image in READY View, the center of each reference slice must be within 0.8 mm of each CSI slice. If a slice that meets this criterion does not exist in the selected reference series, READY View displays an error message, "Localizer loading failed, no matching image". Click OK to the error message. READY View launches, but an image does not display in the lower-left viewport. To avoid this problem, follow these guidelines when prescribing a 3D CSI scan.

Important: Do not save the 3D CSI protocol as an oblique plane. Save the protocol as an axial plane and then change the plane to oblique when you are viewing/editing the series.

Step-by-step instructions

  1. Place the sagittal and coronal images (if you are depositing the VOI on an axial) in two of the localizer viewports.
    • Use the middle mouse button to select the desired viewport.
    • Using the left mouse to select these viewports will deposit the VOI and you are not ready to do that until step 3.
  2. Place the image on which you want to deposit the VOI in the third viewport.
  3. To define the first slice of the VOI, navigate to the desired slice and click Start on the Spectro Graphic Rx pull-down menu.
  4. Scroll to the last slice you want covered by the VOI and click End.
    • This defines the VOI thickness.
    • Do not change the voxel thickness by any means after this step. If you need to change the VOI thickness, then click Erase All and start at step 3.
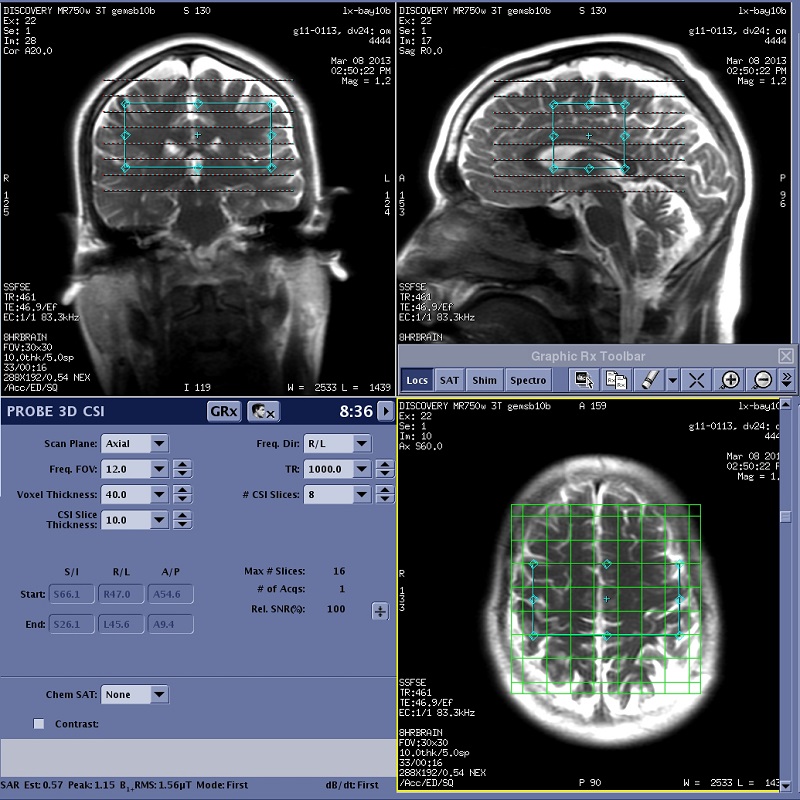
  5. Click CSI Grid and only resize the VOI on the plane that displays the grid.
    Figure 1. Example of: Axial image displaying CSI grid
  6. Click SAT and deposit the SAT pulses.
  7. From the Graphic Rx Tools menu, click Loc Ref Lines.
  8. Scroll to the image where you defined the start location. On one of the orthogonal images, verify that the yellow reference line passes through one edge of the VOI.
  9. Scroll to the slice where you defined the end location. On one of the orthogonal images, verify that the yellow reference line passes through the opposite edge of the VOI.
  10. Click SaveRx.
    • If required, press Move to Scan.
  11. Click Scan > Auto Prescan to start the APS processes.
    • The APS processes optimize the transmit (TG) and receiver gains (R1 and R2), the center frequency, the shim (the Autoshim process), and, specific to the spectroscopy pulse sequences, the power of the water suppression pulses.
  12. Optional: Click Scan > Spectro Prescan to acquire and display the spectroscopy data. This step is typically only performed by research sites.
  13. Click Scan.