

- 00000018WIA30065970GYZ
- id_400268311.2
- Mar 16, 2022 2:19:54 PM
2D ROI
Use these steps to deposit a 2D ROI on a spectroscopy image and view the corresponding spectrum.
READY View computes a metabolite’s values using two different methods that may lead to differences when the values are displayed in the graph view or in the viewport.
- When displayed in the graph view, a metabolite’s values are derived from the average signal curve of all voxels included in the ROI. These values correspond to the values reported by the curve that is displayed in the graph view.
- When displayed in the viewport, a metabolite’s values are first derived from the signal curve coming from each individual voxel included in the ROI. A metabolite’s values from all voxels are then averaged. These values correspond to the values reported by the metabolite’s maps.
- From the Measure/Annotate toolbar, select a 2D ROI cursor: either elliptic or rectangular.
Figure 1. Example of Measure/Annotate tool bar that shows rectangular ROI selected 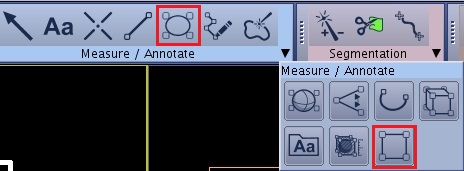
- Position the ROI within the spectroscopy voxels.
- The corresponding graph reflects the actual position and size of the ROI within the area of the highlighted spectroscopy voxels.
- Click the center dot of the ROI to move the ROI within the voxels and observe the corresponding graph changes.
- The graph curve represents the weighted average of the voxels in proportion of the percentage of their area that is within the ROI boundary.
Figure 2. 2D ROI positioned at the top of the selected spectroscopy voxels 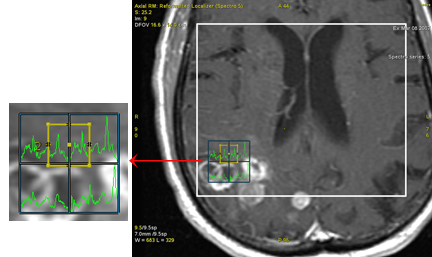
Figure 3. Corresponding spectrum 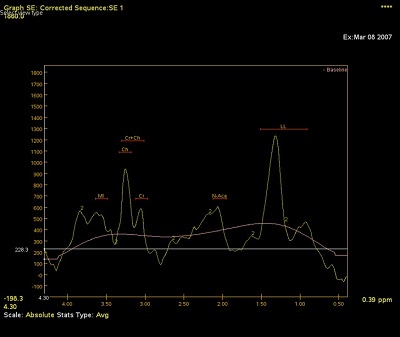
Figure 4. 2D ROI positioned at the bottom of the selected spectroscopy voxels 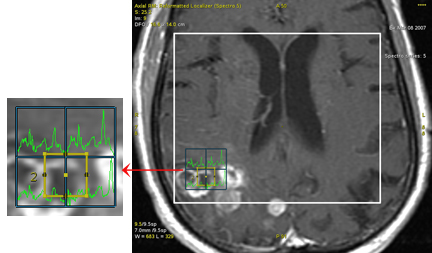
Figure 5. Corresponding spectrum 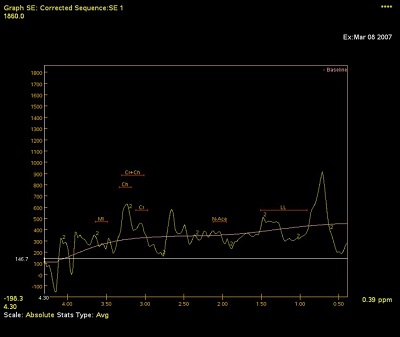
- The graph curve represents the weighted average of the voxels in proportion of the percentage of their area that is within the ROI boundary.
- From the Measure/Annotate toolbar, select a 2D ROI cursor: either elliptic or rectangular.